Table of contents
How to build a content marketing dashboard that drives results
Jun 10, 2025
7 mins read
Written by Ameena Hassan

Ever feel like you’re piecing together a puzzle just to understand how your content is performing? One tab shows traffic, another engagement, and a third conversion; by the time you’ve pulled it all together, the moment’s gone.
That’s where a content marketing dashboard changes the game. It brings all your key metrics, web performance, social engagement, and SEO results into one clear, connected view. No more guesswork, no more digging through scattered tools.
In this guide, we’ll show you how to build a content marketing dashboard that doesn’t just display data; it helps you act on it. You’ll discover the must-have metrics, the right setup process, and how a smart tool like Usermaven simplifies the entire journey from raw numbers to real results.
What is a content marketing dashboard?
A content marketing dashboard is your command center for content performance. Instead of jumping between tools and spreadsheets, it brings everything together in one clear, visual interface. Think of website traffic, social engagement, SEO results, email metrics, ad performance, and CRM data all in one place.
More than just a data aggregator, a great content marketing dashboard tells the full story of your content strategy. It connects the dots between traffic, engagement, conversions, and revenue, turning fragmented stats into actionable insights. With a single source of truth, you can easily spot trends, double down on what’s working, and fix what’s not without drowning in data.
Why content marketing dashboard matters
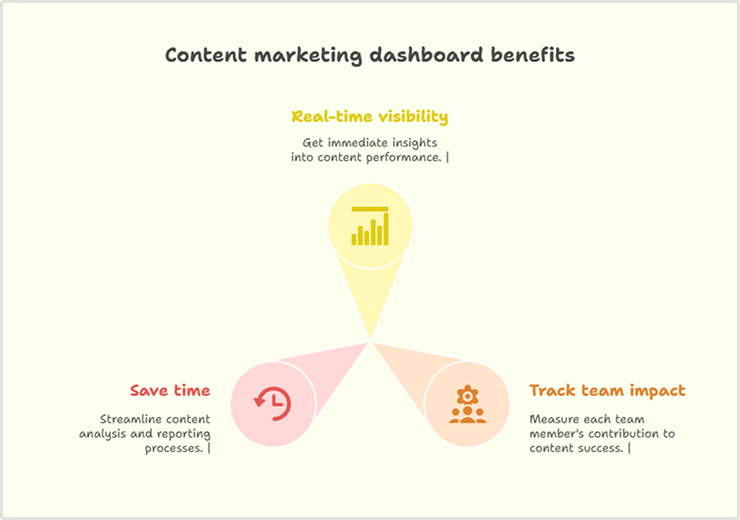
A content marketing dashboard isn’t just a nice-to-have; it’s a competitive edge. Here’s why:
- Real-time visibility: When a post, email, or campaign gains traction, you’ll see it immediately and can act fast.
- Prove ROI: Easily link content to leads, conversions, and revenue to justify investment to stakeholders.
- Track team impact: Everyone can see how their work contributes to broader goals, driving focus and accountability.
- Save time: Teams report saving 5–10 hours per week by eliminating manual reporting, time that goes back into strategy and execution.
In short, a well-built content marketing dashboard gives you the clarity, speed, and insight needed to move from reactive reporting to proactive content strategy.
Key metrics to include in your content marketing dashboard
The success of your content marketing dashboard depends on more than just visuals; it’s all about tracking the right data. The goal isn’t to monitor every metric under the sun but to focus on those that directly support your content strategy and business goals. Whether you’re aiming for buyer awareness, lead generation, or customer retention, your content marketing dashboard should adapt to your objectives.
Here are the four core categories of metrics your dashboard should include:
Audience and reach metrics
Before content performs, it needs to be seen.
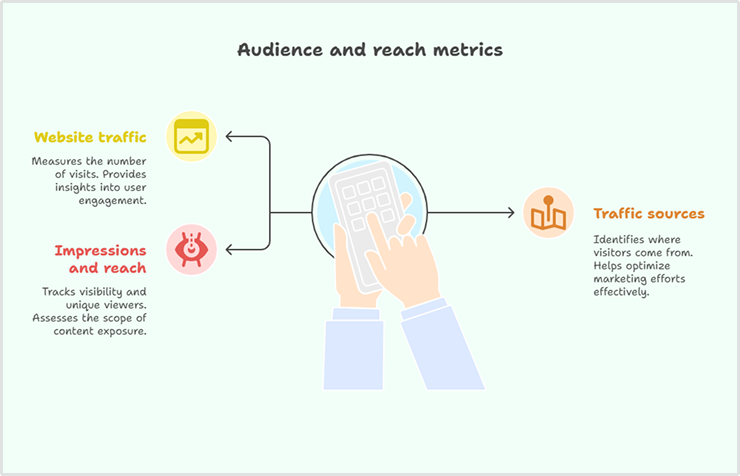
Audience and reach metrics help you understand how visible your content is, who’s seeing it, and which channels are driving that visibility. It’s your first clue into whether your content is showing up in the right places and attracting the right audience.
Website traffic
Track total sessions and unique visitors to assess your content’s reach. Unique visitors reflect how many individual users you’re attracting, while sessions show how often they return.
Traffic sources
Break down traffic by channel, organic search, social media, referral, email, or direct. This tells you where your audience is coming from and helps you double down on high-performing channels.
Impressions and reach
Impressions reflect how often your content is displayed, especially on social and paid platforms. Reach tells you how many unique users were exposed to your content.
Audience and reach metrics set the foundation. They show you where your content is making noise so you know where to keep shouting and where to shift gears.
Engagement metrics
Attention is earned, not given.
Once your content reaches people, the next challenge is to keep them engaged. Engagement metrics reveal how your audience interacts with your content, whether they stay, scroll, click, or leave.
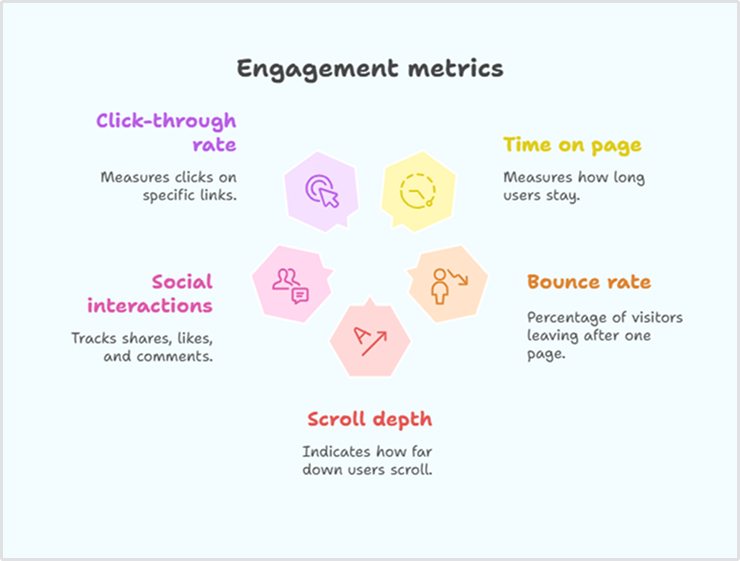
Time on page and session duration
These metrics measure how long visitors stay with your content. Higher time on the page generally indicates more engaging or valuable content, but ideal benchmarks vary by format.
Bounce rate
Shows the percentage of visitors who leave after viewing only one page. While often seen as negative, high bounce rates may be acceptable for quick-answer blog posts or single-purpose landing pages.
Scroll depth
This metric tracks how far users scroll through a page. It’s especially useful for evaluating long-form content and identifying drop-off points.
Social interactions
Includes likes, shares, comments, and saves across platforms. High engagement here shows your content is resonating beyond just clicks, it’s sparking conversations and visibility.
Click-through rate (CTR)
Measures how often users click on calls-to-action, links, or email subject lines. A solid CTR indicates that your messaging and design are effective.
Engagement metrics don’t just show interest; they reveal impact. They help you fine-tune what keeps your audience hooked and what sends them bouncing away.
Conversion and ROI metrics
Good content doesn’t just inform; it converts.
This is where performance meets business impact. Conversion and ROI metrics measure how effectively your content drives desired actions, from lead generation to revenue.
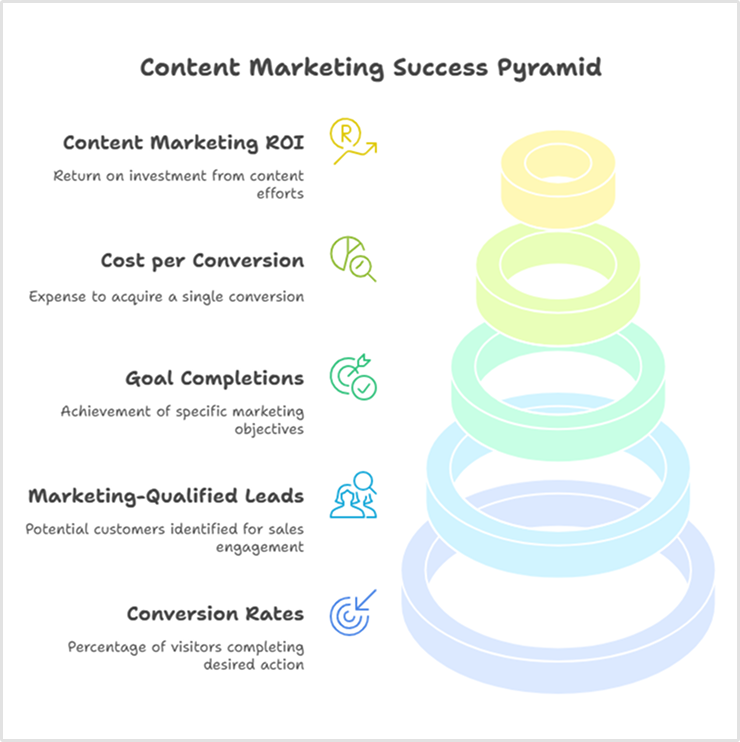
Conversion rates
Track the percentage of users who complete key actions, such as form submissions, demo requests, or purchases. Conversion rate is a direct indicator of performance tied to goals.
Marketing-qualified leads (MQLs)
These are leads that show enough interest or engagement to be passed to sales. Tracking MQLs helps assess whether your content is attracting the right audience.
Goal completions
From email signups to downloads, goal tracking in your dashboard shows how content supports broader campaigns.
Cost per conversion
This calculates how much you’re spending to convert one lead or customer. It’s vital for measuring the efficiency of your content strategy.
Content marketing ROI
Compare content-generated revenue against production and promotion costs. It’s complex but necessary for long-term investment planning and stakeholder confidence.
Conversion and ROI metrics prove your content’s worth in hard numbers. They connect creativity to business outcomes, and that’s where content earns its seat at the table.
SEO metrics
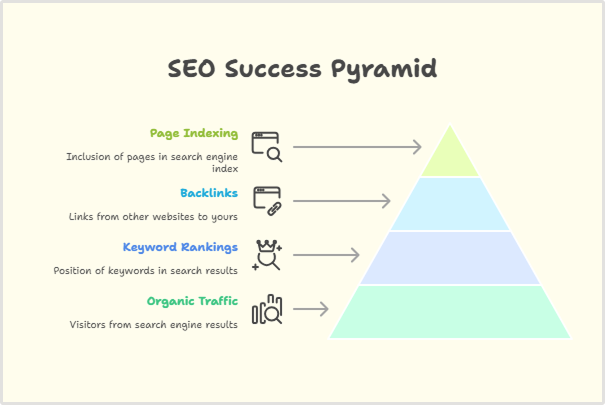
Search visibility builds momentum over time.
While some content wins attention quickly, SEO is about consistent, compounding gains. SEO metrics show how discoverable your content is in search engines and whether it’s building long-term authority.
Organic traffic
Shows how many users find your content via search engines. A healthy upward trend signals growing visibility and SEO effectiveness.
Keyword rankings
Track how your content performs for specific keywords. This helps you refine your targeting and see where you’re climbing or slipping.
Backlinks and referring domains
These metrics reflect your content’s credibility. More quality backlinks typically mean stronger domain authority and better search performance.
Page indexing and crawl errors
Ensure search engines can access and understand your content. Regular indexing checks help maintain healthy site visibility.
SEO metrics are your long game; they turn every well-optimized piece of content into a persistent traffic source that keeps working long after publication day.
Summary: Metrics to match your goals
| Content objective | Primary metrics | Supporting metrics |
| Brand awareness | Impressions, Reach | Social engagement, Traffic volume |
| Lead generation | Conversion rate, MQLs | Landing page performance, Form completions |
| Customer education | Time on page, Resource downloads | Support ticket reduction, Product usage/adoption |
| Thought leadership | Backlinks, Industry mentions | Social shares, Speaking invitations |
A great content marketing dashboard isn’t just a place to store data; it’s a tool that helps your team grow smarter and act faster. With the right metrics, clearly segmented and contextualized, you’ll be able to connect performance with strategy, uncover opportunities, and prove the value of your content at every level.
How to build your content marketing dashboard: a step-by-step guide
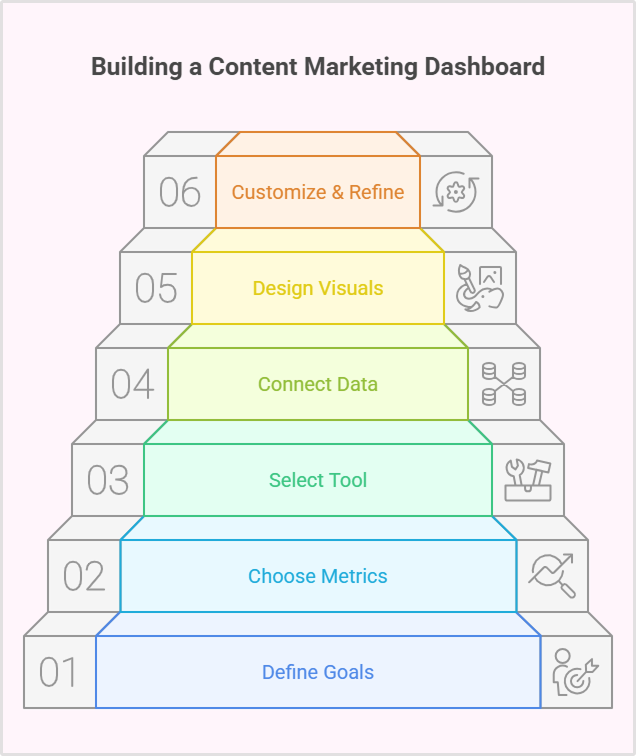
Creating an effective content marketing dashboard requires thoughtful planning and execution. Follow these steps to build a dashboard that delivers real value to your marketing efforts.
Step 1: Define your goals and objectives
Start by clearly stating what you want your content to achieve. Are you focused on building brand awareness, generating leads, nurturing prospects through the sales funnel, or supporting customer retention? Your goals determine which metrics matter most. For example, if lead generation is your priority, conversion rates and lead quality metrics deserve prominence in your dashboard.
Link these content goals directly to broader business objectives to ensure alignment. Your dashboard should tell a clear story about how content contributes to company growth, customer acquisition, or other key business priorities.
Step 2: Choose your metrics
With your goals defined, select specific key performance indicators (KPIs) that measure progress toward those goals. Choose primary metrics that directly reflect goal achievement and supporting metrics that provide context and insight into performance drivers.
For example, if increasing organic search traffic is a goal, your primary metric might be organic sessions, supported by keyword rankings, click-through rates from search results, and on-page engagement metrics that influence search performance.
Avoid metric overload by limiting your selection to those that genuinely inform decisions. Each metric should earn its place by answering an important question about your content performance.
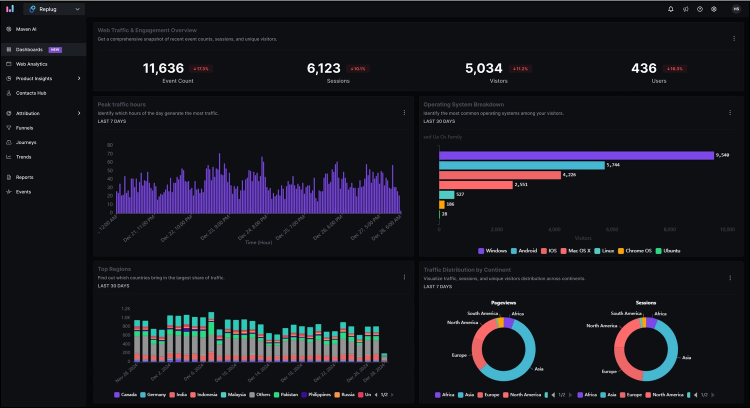
Step 3: Select a dashboard tool
Your choice of dashboard tool affects everything from data integration capabilities to visualization options and sharing possibilities.
Spreadsheet solutions like Excel or Google Sheets offer flexibility and familiarity but require manual data entry or custom integration work. They work well for smaller operations or as starting points before investing in specialized tools.
Dedicated analytics platforms like Usermaven provide more robust capabilities with automatic data collection, real-time updates, and purpose-built visualizations for marketing metrics. Usermaven stands out by offering automatic event tracking without requiring technical implementation, making it particularly accessible for marketing teams without dedicated analytics support.
When evaluating tools, consider your technical resources, budget, and specific needs around data sources, visualization options, and sharing capabilities.
Step 4: Connect your data sources
Most content marketing programs use multiple platforms, such as website analytics, social media tools, email marketing systems, CRM platforms, and more. Your dashboard needs to pull data from all relevant sources to provide a complete picture.
Set up integrations between your dashboard tool and each data source. Look for direct API connections that automatically refresh data rather than manual import processes that quickly become outdated. Integrations Hub simplifies this process by connecting with popular marketing tools through ready-made integrations.
Ensure consistent data definitions across platforms; for instance, what counts as a “conversion” should be defined the same way in all your tracking systems to prevent confusion.
Step 5: Design and visualize your data
Effective dashboard design balances completeness with clarity. Organize your metrics into logical sections based on the content journey (awareness, engagement, conversion) or by channel (website, social, email).
Choose appropriate visualization types for different metrics:
- Line charts work best for showing trends over time
- Bar charts compare values across categories
- Pie charts show composition when there are few audience segments
- Tables display detailed numbers when exact values matter
Keep your dashboard clean and focused by limiting each section to essential metrics. Use color coding consistently, for instance, always using the same color for conversion-related metrics across different visualizations.
Step 6: Customize and refine
Create different views for different users. Executive stakeholders might need high-level performance summaries, while content creators benefit from detailed breakdowns by content piece or topic. Adding filters allows users to drill down into specific time periods, content types, or channels.
After initial setup, gather feedback from users and refine accordingly. Dashboard development should be iterative, continue improving based on evolving needs and discover which metrics actually drive decisions.
By following these steps, you’ll build a content marketing dashboard that delivers clear insights and drives smarter decisions. Keep it focused and aligned with your goals, and continuously refine it to make your content strategy more effective and impactful.
Why Usermaven is the ideal choice for your content marketing dashboard
When it comes to measuring content marketing success, selecting the right content marketing dashboard is crucial. Usermaven stands out as a powerful yet user-friendly platform designed specifically for marketers who want actionable insights without the complexity of traditional analytics tools.
Simplified analytics built for marketers
Usermaven eliminates the steep learning curve often associated with advanced analytics. Its custom dashboards adapt seamlessly to your content marketing needs, allowing you to create tailored views by campaign, content type, or team role. This means everyone sees the most relevant data without distractions.
Fully customizable dashboards for your unique needs
Usermaven offers extensive dashboard customization options. You can choose which metrics to display, arrange widgets for easy navigation, and design views that highlight the most important insights for your team. This flexibility ensures your dashboard reflects your unique content goals and workflow.
Real-time data for agile decision-making
Marketing moves fast, and so should your data. Usermaven provides real-time reporting, ensuring your team always works with fresh insights. Spot trends, adjust strategies, and capitalize on content that’s gaining momentum without delay.
Automatic event tracking with no coding required
One of Usermaven’s standout features is its automatic event tracking. It captures key user interactions, like clicks, scrolls, and form submissions, right out of the box without any technical setup or coding. This frees up your team to focus on analysis and strategy rather than tracking configurations.
Advanced segmentation for deeper audience insights
Understanding how different audience segments engage with your content is essential. Usermaven offers powerful segmentation tools that let you filter data by acquisition source, location, device, and custom user properties. This helps you tailor content and campaigns for maximum impact.
Seamless integrations with your marketing stack
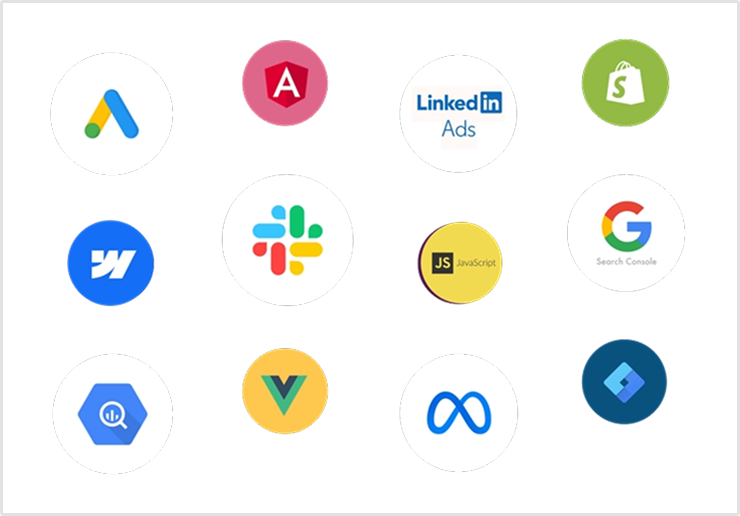
Usermaven’s Integrations Hub connects effortlessly with popular analytics, CRM, and marketing automation platforms. This unified approach means your dashboard reflects performance across every channel and touchpoint, giving you a holistic view of your content’s effectiveness.
Privacy-friendly analytics with high data accuracy
In an era of increasing privacy regulations and ad blockers, maintaining accurate data is challenging. Usermaven’s privacy-first design ensures high-quality data collection without compromising user privacy, making your insights more reliable and compliant.
Easy sharing for better collaboration
Collaboration is key to marketing success. Usermaven allows you to share dashboards easily with team members and stakeholders without complex permission setups or logins. This transparency promotes informed discussions and speeds up decision-making across your organization.
Power up your SaaS
with perfect product analytics
*No credit card required
By combining simplicity, accuracy, and powerful features, Usermaven empowers marketing teams to create content marketing dashboards that do more than track performance; they drive strategy and business growth.
Conclusion about content marketing dashboard
A clear, well-designed content marketing dashboard helps you track the right metrics, make smarter decisions, and improve your strategy. By focusing on relevant goals and using the right tools, you gain better insights and measurable results.
Platforms like Usermaven simplify analytics, making it easy for any team to create effective dashboards without technical hurdles. As your business evolves, so should your dashboard, becoming a key tool for ongoing growth and success.
Maximize your ROI
with accurate attribution
*No credit card required
FAQs about content marketing dashboard
1. What is the primary goal of a content marketing dashboard?
The primary goal of a content marketing dashboard is to centralize key performance metrics, giving marketers clear insights to optimize strategy and measure content impact.
2. What are some key metrics to track in a content marketing dashboard?
Key metrics to track include traffic (sessions, page views), engagement (time on page, bounce rate), conversions (form completions, conversion rate), leads (MQLs, SQLs), revenue (ROI, sales), and SEO (keyword rankings, backlinks).
3. How often should I review my content marketing dashboard?
Review your content marketing dashboard daily for active campaigns, weekly for key metrics, and monthly for in-depth strategic analysis.
Try for free
Grow your business faster with:
- AI-powered analytics & attribution
- No-code event tracking
- Privacy-friendly setup


