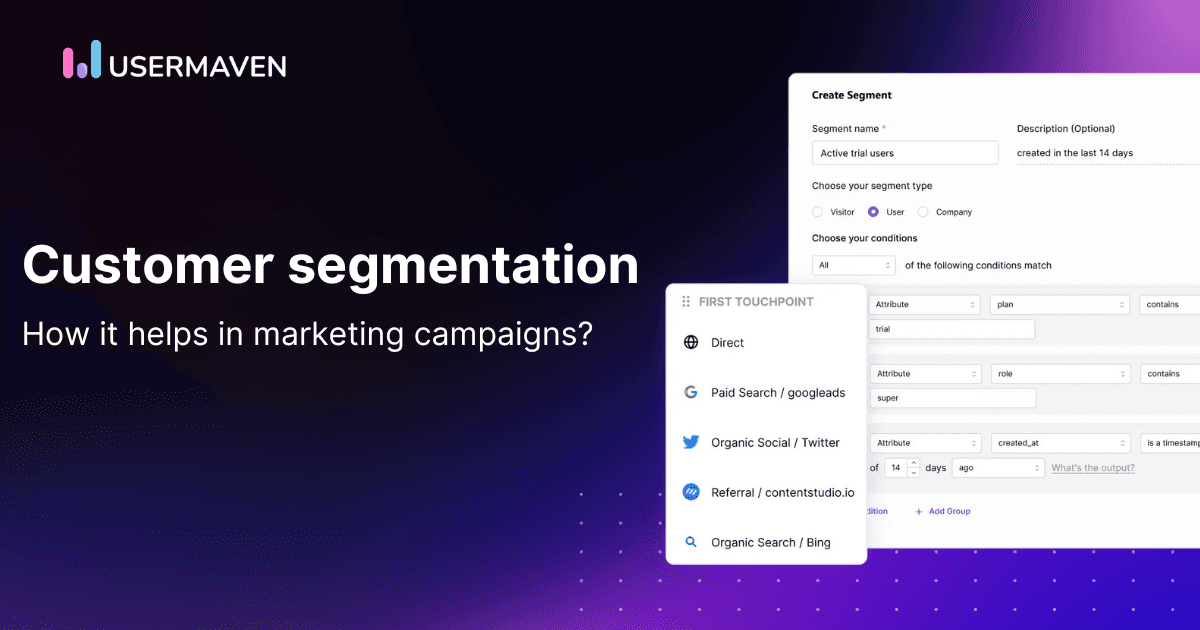
Customer segmentation analysis: Methods, examples, and a step-by-step guide
Customer segmentation analysis helps marketers answer a question that a list of customer groups cannot: which audiences behave differently, why those differences matter, and what should change as a result? The goal is not to create more labels. It is to discover meaningful differences in acquisition, conversion, retention, and customer value so teams can make better decisions.

For B2B teams, customer segmentation by company characteristics and buying behavior is a useful starting point. But the analysis only becomes valuable when it reveals which accounts activate, convert, retain, or generate sustainable revenue. The same principle applies to ecommerce and subscription businesses.
This guide explains the types of customer segmentation, how to analyze them with practical methods, which metrics to compare, and how to test whether your segments are useful. It also shows where Usermaven can help connect audience behavior with marketing and product outcomes.
Key takeaways
- Start with a decision: Choose the business question before selecting a segmentation model.
- Measure differences: Compare conversion, retention, value, and acquisition quality rather than segment size alone.
- Choose the right method: Rules and RFM are accessible starting points; cohorts and clustering answer different questions.
- Validate the findings: Check sample sizes, time windows, data quality, and whether differences persist.
- Turn insight into action: Every useful segment should change a message, journey, experience, or resource decision.
What is customer segmentation analysis?
Customer segmentation analysis is the process of dividing an existing customer or user population into meaningful groups, then comparing those groups to understand behavior, needs, performance, and business value. It combines a segmentation method with analysis of the outcomes each segment produces.
A segment might be “trial users who completed onboarding but did not invite a teammate.” The analysis asks whether that group is less likely to activate, which acquisition sources bring those users, and whether a different onboarding experience changes their outcomes.
It helps to distinguish related terms:
| Term | What it answers | Example |
|---|---|---|
| Customer segmentation | Which groups exist? | Customers grouped by plan, industry, or purchase behavior |
| Customer segmentation analysis | How do groups differ and what should we do? | Comparing activation and retention across plans or industries |
| Market segmentation | Which groups exist in the broader potential market? | Small retailers, enterprises, and direct-to-consumer brands |
| Buyer persona | Who is a representative decision-maker? | A revenue operations leader concerned about CRM data quality |
| Ideal customer profile | Which account types are the best fit? | B2B SaaS firms with defined acquisition and revenue workflows |
Customer segmentation analysis can be descriptive, such as finding that one group purchases more frequently, or diagnostic, such as investigating why another group drops out during onboarding. Analysis can identify associations; proving that a segmentation-based intervention caused an improvement usually requires an experiment or a stronger causal design.
Target the right audience
with Usermaven Segments
Why customer segmentation analysis matters
Without analysis, teams may build segments that look intuitive but do little to improve decisions. Age brackets, company sizes, and subscription plans are easy to define, yet those categories only matter when they predict a different need, experience, or result.
Marketing allocation. Comparing acquisition channels and attributed outcomes by segment can reveal whether a source brings high volumes of low-fit visitors or fewer customers who are more likely to convert and remain active. The right comparison includes spend and measurement coverage, not simply leads generated.
Conversion improvement. Segment-level funnels can expose different drop-off points. A self-serve SaaS visitor and an enterprise buyer may require different paths to a meaningful conversion, so a single site-wide conversion rate can conceal the problem.
Retention and customer value. Comparing customer cohorts and purchase behavior can distinguish one-time buyers from repeat purchasers, or trial users who activate from those who never adopt the product. These findings can guide onboarding and lifecycle priorities.
More relevant customer experiences. A segmentation strategy earns its place when it enables a realistic action, such as changing product education, tailoring a message, or assigning sales support. A group that cannot be reached or treated differently may not justify ongoing reporting.
Types of data used in customer segmentation analysis
Different models answer different questions. Many teams begin with a clear business rule and later combine attributes with observed behavior. Choose only the variables you can collect lawfully, explain clearly, and use in a decision.
Demographic and geographic segmentation
Demographic variables include age bands, occupation, or household characteristics when appropriate to the product and supported by consent and a lawful data basis. Geographic analysis groups customers by country, region, city, or other relevant locations.
These categories may help with regional product demand, availability, or localized messaging, but they should not be treated as explanations for buying behavior on their own. Avoid sensitive or proxy characteristics where they are unnecessary or could lead to unfair treatment.
For example, a clothing brand planning seasonal collections may compare category interest and repeat-purchase patterns across the regions it serves. Location is an input; the useful insight comes from pairing it with actual customer needs and outcomes.
Behavioral segmentation
Behavioral analysis uses observed events: pages viewed, onboarding steps completed, features used, purchase frequency, repeat visits, or response to a campaign. An account that invited several team members may need a different product experience from an account that created a workspace but took no further action.
It matters how behavior is defined. “Active” should refer to meaningful product use, not merely a page load. Define the event and time window before comparing segments so the metrics remain consistent.
Firmographic and technographic segmentation
For B2B businesses, firmographics include industry, employee count, region, revenue band, and account type. Technographics describe systems the customer uses, such as a CRM, billing platform, or analytics stack. These attributes can affect purchasing requirements, implementation complexity, and sales cycles.
Be careful about the unit of analysis. An enterprise account with 25 active users is one company, not 25 independently won customers. Account-level and user-level conversion rates answer different questions.
Needs-based and psychographic segmentation
Needs-based groups reflect the jobs customers are trying to accomplish, while psychographic groups reflect motivations or preferences. These often require interviews, surveys, or other explicit research rather than guesses derived from clicks.
Combine what customers say with what they do. Survey responses can help explain an observed pattern, but a single interview quote should not be generalized to an entire segment.
Value-based and lifecycle segmentation
Value-based segmentation compares economic outcomes such as gross margin, revenue, customer lifetime value, or cost to serve. Lifecycle segmentation distinguishes new, activated, repeat, at-risk, and reactivated customers.
Value and lifecycle often work best together. A high-spending customer who has stopped returning calls for a different response than a new customer whose initial purchase happens to be large.
How to conduct customer segmentation analysis in seven steps
The most useful workflow starts with a decision and ends with a measurable action. It does not require machine learning: a few clearly defined groups and trustworthy outcome metrics can be enough.
Step 1. Define the business question and decision
Write down one concrete question: Which onboarding behavior predicts activation? Which customer groups have the strongest repeat purchase rate? Which B2B account types produce qualified pipeline rather than only form submissions?
Choose the decision that would change if you found a difference, such as onboarding sequence, paid channel budget, account prioritization, or lifecycle message. Assign an owner to the result.
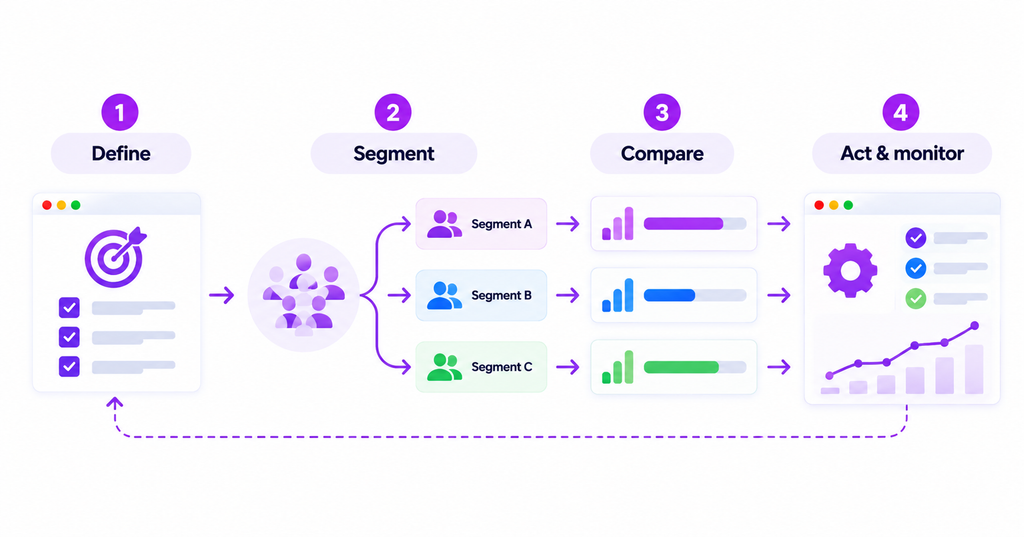
Step 2. Choose the population, unit, and time window
Decide whether the population contains visitors, users, leads, accounts, or paying customers. Specify inclusion and exclusion criteria, time zones, and the observation period. A customer who purchased last month should not be compared with one who has had twelve months to make a repeat purchase without accounting for exposure time.
For B2B SaaS, an account-level analysis may be appropriate for pipeline and revenue. For product adoption, user-level or account-level behavior can each be useful, but the denominator must match the question.
Step 3. Collect and reconcile the required data
Common inputs include CRM lifecycle stages, web acquisition data, product events, billing transactions, purchases, and customer interviews. Match records using stable identifiers when possible and document what remains unmatched.
Resolve duplicate customers, inconsistent currencies, missing channel values, and changed event names before measuring segment differences. Incomplete tracking can make one channel or group look weaker even when its actual performance is similar.
A marketing attribution software workflow becomes more useful when acquisition and conversion events are connected consistently to customer or account outcomes, instead of being reviewed as unrelated reports.
Step 4. Select a segmentation method
Start with business rules when they reflect a real decision. For example, define a segment as trial users who completed signup, viewed the setup page, and did not create a first report within seven days.
For transactional businesses, RFM analysis is a useful option. Use cohorts when timing and retention matter. Consider clustering only when the dataset is adequate, the variables are meaningful, and the resulting groups can be interpreted by the business.
Step 5. Compare outcomes across segments
Build a simple scorecard for segment size, conversion rate, retention, acquisition mix, and customer value, using the same measurement window. Include totals alongside rates: a small group with a high conversion rate can still contribute little overall revenue.
Compare an appropriate baseline. That could be the full eligible population or the same segment in a previous period. Avoid mixing new customers with mature customers in retention comparisons.
Step 6. Translate differences into a testable action
For each important difference, record the observation, a possible explanation, and one proposed change. For example, a slower activation rate among accounts with multiple stakeholders may justify an onboarding experience designed for team invitations.
Treat explanations as hypotheses rather than facts. Test changes where feasible through a randomized experiment, holdout, or carefully constructed comparison. Improvements after a campaign do not automatically prove the campaign caused them.
Step 7. Monitor, validate, and refresh the model
Recheck the model when customer behavior, products, pricing, or acquisition channels change. Track whether the segments remain stable and whether actions continue to produce meaningful differences.
Document the owner, definition, refresh frequency, and decision rule for each segment. A small collection of well-maintained segments is more useful than dozens of labels nobody trusts.
Customer segmentation analysis methods compared
Customer segmentation is not one algorithm. The method should match the data available and the decision at hand.
| Method | Best for | How it works | Main limitation |
|---|---|---|---|
| Rule-based | Operational targeting | Defined conditions on attributes or events | Depends on chosen rules |
| RFM | Purchase behavior | Recency, frequency, monetary value | Limited for nontransactional journeys |
| Cohort analysis | Retention and timing | Compare groups sharing a starting event/period | Needs comparable follow-up windows |
| Cluster analysis | Exploring complex patterns | Groups observations by selected features | Sensitive to feature choices and interpretation |
| Needs-based research | Motivations and problems | Interviews, surveys, qualitative coding | Self-report and sampling bias |
RFM analysis: Recency, frequency, and monetary value
RFM assigns customers three measures: how recently they purchased, how frequently they purchased in a defined period, and how much they spent in that period. Businesses often bin or rank these measures, then investigate the resulting groups.
Do not assume every industry needs the same scoring thresholds. A repeat purchase after three months may be normal for a durable product but unusual for a grocery subscription. Use the actual purchase cycle to define meaningful ranges.
RFM is primarily descriptive. A higher monetary score does not prove a customer is more profitable without considering returns, discounts, and servicing costs.
Cohort analysis: Compare customers at similar lifecycle stages
A cohort groups customers by a shared starting point, such as first purchase month or signup week. Then the analysis tracks their outcomes at comparable intervals, such as day 7 activation or month 3 retention.
Cohorts help avoid the misleading comparison of customers who have had very different amounts of time to convert or return. They are particularly useful for onboarding and retention, where an overall average can hide a deteriorating experience for new customers.
Cluster analysis: Discover groups without predefined labels
Clustering methods, including k-means, can identify patterns in numeric features without the analyst specifying every segment boundary. But using more variables does not automatically create better segments.
Standardize features where appropriate, consider outliers and missing data, assess whether clusters are reasonably stable, and check that each group has a clear operational meaning. A silhouette score or another statistical criterion can help assess separation, but business usefulness still needs validation.
For many marketing teams, a simple rule-based model produces a more actionable result than an opaque clustering exercise. Advanced customer segmentation techniques become worthwhile when they answer a question simpler methods cannot.
What metrics should you compare across segments?
The right metrics depend on the objective. Use definitions and denominators that reflect the business, and separate observed performance from modeled or attributed outcomes.
| Metric | Practical definition | Key caution |
|---|---|---|
| Segment size | Eligible customers, users, or accounts | State the unit and observation period |
| Conversion rate | Converters ÷ eligible population | Align eligibility and conversion window |
| Activation rate | Activated users/accounts ÷ eligible signups | Define meaningful activation clearly |
| Retention rate | Customers active/retained at a later interval ÷ eligible cohort | Compare cohorts at the same age |
| Average order value | Transaction revenue ÷ qualifying orders | Discounts and refunds affect interpretation |
| Customer lifetime value | Expected economic value across a customer relationship | State model assumptions; revenue is not profit |
| Cost per acquisition | Relevant acquisition spend ÷ acquired customers | Align spend, channel, and time windows |
| Revenue by segment | Observed revenue from members of the segment | Avoid double counting across overlapping groups |
| Attributed revenue | Revenue credited to marketing under a named attribution model | Attribution is not proof of incrementality |
A useful segmentation report includes both rates and absolute totals. If a small segment has a higher conversion rate, it may still be less important than a larger segment generating more valuable customers. Conversely, a large segment with poor retention can consume resources without creating durable value.
For cross-channel planning, separate platform-reported conversions, verified CRM outcomes, and revenue attribution according to their definitions. A single figure without measurement context can lead to the wrong budget decision.
Customer segmentation analysis examples
The following are illustrative workflows, not real customer performance datasets. They show how a team could structure an analysis using its own evidence.
Example 1. B2B SaaS: Find activation barriers by company type
A SaaS platform groups new accounts by employee band and initial product behavior. The team compares whether accounts that invite teammates and connect a data source activate differently from accounts that stop after signup.
The useful next step is not to label smaller companies as “low quality.” It is to examine whether setup requirements, permission constraints, or missing guidance explain the difference. The team could test onboarding variations, then compare activation and later retention at the account level.
Example 2. Ecommerce: Compare repeat purchases across shopper groups
An ecommerce retailer groups customers by first-purchase category and purchase recency. It then compares repeat purchase rates and gross margin for cohorts with equal follow-up time.
If a segment repeatedly buys replenishable goods, the retailer might test a timely replenishment reminder. If another buys seasonal collections, broader discounting may not be the best solution. The decision should depend on actual behavior and profitability, not a demographic stereotype.
Example 3. B2B agency: Compare lead volume with qualified pipeline
A marketing agency groups inbound leads by source, industry, and whether they reached a qualified opportunity stage in the CRM. It evaluates both acquisition volume and downstream business outcomes.
This may reveal that the channels with the most form fills are not the channels producing the strongest qualified pipeline. The agency can use the finding to refine campaign targeting, but should document attribution rules and account for sales-cycle differences before moving budget.
Example 4. Subscription product: Investigate retention by onboarding cohort
A subscription team compares signup cohorts according to whether they used a core feature within their first week. It examines retention at a common interval and identifies whether the pattern persists by acquisition channel.
If early feature use correlates with retention, the team can test an onboarding change that encourages that action. It must not assume that users retain because they performed the event; more motivated customers may simply be more likely to do both.
How to validate segments and avoid misleading findings
A segmentation model can be mathematically tidy and still lead to bad decisions. Validation should be part of the workflow, not an optional technical appendix.
Check data quality and identification
If anonymous visitors cannot reliably be connected to later customer records, the resulting acquisition and conversion comparisons may exclude important journeys. Identify missing identifiers and report the share of outcomes that cannot be assigned confidently.
Compare fair populations and time windows
A new subscriber does not have the same retention opportunity as a long-standing subscriber. Use cohorts with comparable follow-up and distinguish conversion windows from reporting windows. For acquisition analysis, align marketing spend and conversion credit to a documented method.
Protect against tiny or unstable groups
Small segments can show dramatic percentage changes based on very few events. Include counts and note low-sample uncertainty. Avoid creating highly granular segments that cannot support reliable conclusions or meaningful interventions.
Avoid confusing correlation with causation
Suppose high-value customers frequently use a product feature. That does not establish that prompting everyone to use the feature will create high-value customers. Test interventions with comparable groups and evaluate outcomes that matter, not just feature clicks.
Check privacy and fairness
Collect only appropriate data, respect consent and retention requirements, and review whether segment rules create unfair treatment or reveal sensitive characteristics indirectly. Relevance should not come at the expense of customer trust.
How to conduct segmentation analysis with Usermaven
Usermaven combines audience segments with web and product analytics so teams can compare user behavior and conversion performance without reducing the analysis to a static spreadsheet. Its documented Segments feature supports visitor, user, lead, and company types, with filters based on attributes, events, behavior, and acquisition sources.
Create a meaningful segment
In Usermaven, open Contacts Hub and select the appropriate visitor, user, or company view, or create a segment from the Segments section. Choose a segment type, add conditions, and combine them with AND/OR logic where required. For event-based conditions, refine the event count or time frame if the workflow calls for it.
For example, a SaaS team could define a segment of trial accounts whose members visited the pricing page but did not complete a particular activation event. The exact event names depend on the team’s own implementation and should be checked before interpreting the group.
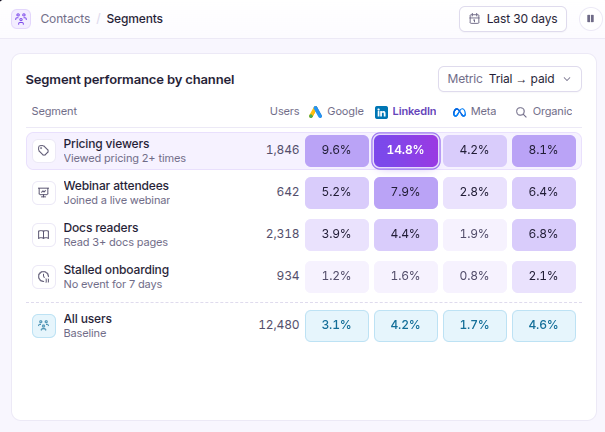
The Usermaven Segments feature supports saved groups and audience analysis, while the Segments documentation explains the filter-building workflow.
Compare funnel outcomes and customer journeys
Once segments are defined, use funnel comparisons to examine where groups diverge during an important conversion path. Usermaven’s funnel documentation supports breaking down and comparing funnel performance by segment, as well as examining step conversion and drop-offs.
For example, an acquisition team may compare trial-to-activation steps across company-level segments, while a product team examines the behavior of users who do and do not reach the product’s first meaningful outcome. A conversion funnel becomes more actionable when its stages are explicitly defined and evaluated for a comparable population.
Connect segment outcomes with acquisition and revenue
Segment analysis becomes commercially relevant when the team can relate behavior to acquisition quality and revenue outcomes. Usermaven’s core positioning is marketing attribution, supported by product analytics, customer journeys, conversion goals, and integrations.
Use the available, properly configured data to compare acquisition sources, conversion behavior, and downstream outcomes. Attribute results only according to the models and connected systems actually in use. Do not assume a saved segment automatically produces a reliable lifetime value estimate or a causal explanation for performance.
For teams trying to connect customer groups with channels, pipeline, and revenue, book a Usermaven demo to explore how its segmentation and attribution workflows fit their measurement setup.
Customer segmentation analysis checklist
Before acting on a segmentation report, confirm the fundamentals:
- The business question and intended decision are documented.
- The population, unit of analysis, time window, and exclusions are clear.
- Segment membership uses consistent, lawful, and trustworthy data.
- Denominators and outcome definitions are comparable across groups.
- Performance includes counts, rates, and relevant financial measures.
- Attribution assumptions and unmatched records are disclosed.
- Small samples and possible selection effects are flagged.
- Each important finding has an owner, hypothesis, and next action.
- The model has a review date and a way to measure whether the action helped.
Final thoughts
Strong customer segmentation analysis is not about creating the largest possible number of customer groups. It is about identifying differences that matter, checking whether those differences are trustworthy, and taking action you can measure.
Start with one business question and a few well-defined segments. Compare the right outcomes, test a meaningful intervention, and improve the model as evidence accumulates. That turns segmentation from a classification exercise into an ongoing decision-making process.
FAQs
What is the difference between customer segmentation and customer segmentation analysis?
Customer segmentation defines groups using shared characteristics or behaviors. Customer segmentation analysis compares those groups to identify meaningful differences in outcomes, explains plausible reasons for those differences, and informs decisions such as targeting, onboarding, and retention.
What are the four main types of customer segmentation?
The familiar four are demographic, geographic, psychographic, and behavioral segmentation. B2B and subscription teams also use firmographic, technographic, value-based, needs-based, and lifecycle approaches. The right method depends on the question and available data.
How do you perform customer segmentation analysis?
Start with a business objective, define the eligible population and time window, prepare customer data, select a segmentation method, compare outcome metrics, test an action, and review the results. Use consistent metric definitions and document data limitations.
Which customer segmentation analysis method is best?
There is no universally best method. Rule-based segments are useful for operational decisions, RFM for transactional behavior, cohorts for retention, and clustering for discovering patterns in larger datasets. Choose the simplest method that produces an interpretable and testable decision.
What is RFM analysis in customer segmentation?
RFM stands for recency, frequency, and monetary value. It groups customers according to when they last purchased, how often they purchased in a period, and how much they spent. Its thresholds should reflect the product’s normal purchasing cycle.
How often should customer segments be updated?

Written by
Adeel Khan
Growth Marketing Expert
Adeel Khan is a full-stack SaaS marketer with 10+ years of experience in content marketing, paid advertising, analytics, and conversion rate optimization. He shares practical insights and strategies drawn from hands-on experience, helping B2B SaaS marketers improve performance and make better marketing decisions.
All articles by Adeel →