Marketing teams rarely lack numbers. They have ad-platform dashboards, website reports, CRM records, and spreadsheets showing what happened. The harder question is what the evidence means and which decision should follow. A data-driven approach makes that decision process more deliberate.
Instead of reacting to clicks or copying last quarter’s campaign, marketers can compare customer behavior, test competing explanations, and evaluate the outcomes that matter. Marketing attribution software is one part of this process, helping teams understand how observed channel interactions relate to conversions and revenue.
Key takeaways
• Decision-making first: Data-driven marketing uses reliable evidence to choose, test, and improve marketing actions, rather than treating dashboard numbers as the strategy itself.
• Quality before quantity: Consistent events, trustworthy customer records, clear definitions, and appropriate permissions matter more than collecting every possible data point.
• A repeatable workflow: Define a decision, collect and validate signals, diagnose patterns, form a hypothesis, run a test, and revisit the result.
• Metrics in context: Clicks and leads can reveal activity, but qualified conversions, acquisition cost, activation, and revenue show whether activity contributes to business goals.
• Measurement has limits: Attribution describes credit across observed touchpoints; incrementality testing addresses whether a marketing activity caused additional outcomes.
• Continuous improvement: Review data regularly and use what you learn to update audiences, messages, landing pages, campaigns, and budgets.
What is data-driven marketing?
Data-driven marketing is the practice of using customer, campaign, and business data to guide marketing decisions. Teams analyze evidence about audience needs, channel performance, and conversions, then use those findings to plan campaigns, personalize experiences, and test improvements.
For example, imagine a SaaS company receiving plenty of paid-search traffic but few trials. Rather than increasing the budget automatically, the team examines search intent, landing-page behavior, and trial-start events. It might then test a clearer page offer before deciding whether the channel deserves more spend.
Data-driven does not mean data-only. Customer interviews, creative judgment, market context, and the limits of the measurement system still matter. A useful strategy brings quantitative evidence and informed human judgment together.
Unlock insights that drive growth
How is it different from traditional marketing?
Traditional planning often begins with broad audience assumptions, prior campaign experience, or channel-level benchmarks. A data-driven process starts with a business question, gathers relevant evidence, and checks whether the proposed action improves a defined result.
| Approach | Planning question | Feedback mechanism |
| Assumption-led | What message do we think will work? | Campaign results reviewed after launch |
| Data-driven | What evidence supports this message for this audience? | Defined baseline, experiment, and decision rule |
The two approaches are not mutually exclusive. A strong campaign can begin with a creative insight and still use data to refine its execution.
Why is data-driven marketing important?
It directs resources toward useful outcomes
A campaign can produce cheap clicks while attracting people unlikely to buy. Looking beyond surface metrics helps a team distinguish traffic generation from qualified demand. Budget decisions become more defensible when they consider conversions, pipeline contribution, acquisition cost, and the quality of acquired customers.
It makes personalization more relevant
Customers behave differently depending on their needs and stage of the journey. Data can help marketers separate a first-time visitor from an engaged product evaluator and tailor the next message accordingly. Personalization should rely on appropriate, consented signals rather than unnecessary surveillance or sensitive inference.
It exposes friction across the journey
Channel reports show where visitors arrive, but they rarely explain everything that follows. Customer journey analytics can help teams examine the paths people take, the pages they revisit, and the points where they abandon an intended action. Those patterns give marketers better questions to investigate.
It turns reporting into a learning process
A weekly dashboard is useful only when it changes a decision or improves shared understanding. Teams should connect every important metric to a possible action, an owner, and a review cadence. That keeps reports from becoming collections of charts nobody uses.
What types of data are used in data-driven marketing?
Effective marketing analysis combines several types of information. None is sufficient on its own, and sources should not be combined unless identifiers, definitions, timing, and permissions make the comparison defensible.
| Data category | Typical signals | Marketing use |
| Campaign | Spend, impressions, clicks, tagged visits | Evaluate delivery and acquisition mix |
| Website | Landing pages, sessions, key events | Diagnose entry-page behavior |
| Product | Activation, feature usage, retention | Examine post-signup quality |
| CRM and sales | Lead stage, opportunity, closed revenue | Connect marketing to pipeline |
| Customer-provided | Preferences, survey answers, form responses | Understand stated needs |
| External market | Industry trends, category demand, contextual research | Inform targeting and planning |
First-party information collected through a brand’s own interactions is usually the most useful starting point. It offers context about an actual relationship, but it still needs governance, clear consent practices, and reliable event definitions.
External datasets can supplement that picture when they serve a legitimate purpose. In specialized B2B sectors such as healthcare, customer data may mean professional contact records, organization information, or market intelligence.
These categories differ considerably, so teams must verify provenance, accuracy, legal permissions, and suitability before use.
Data quality also affects downstream interpretation. A duplicated conversion event, inconsistent campaign names, or a mismatch between CRM stages can distort performance. Establishing data governance best practices early is easier than repairing conclusions after decisions have been made.
How to build a data-driven marketing strategy
A practical strategy is a repeatable decision system, not a one-time dashboard project. Use the following six stages and document who owns each stage, which questions it answers, and what would justify a change.
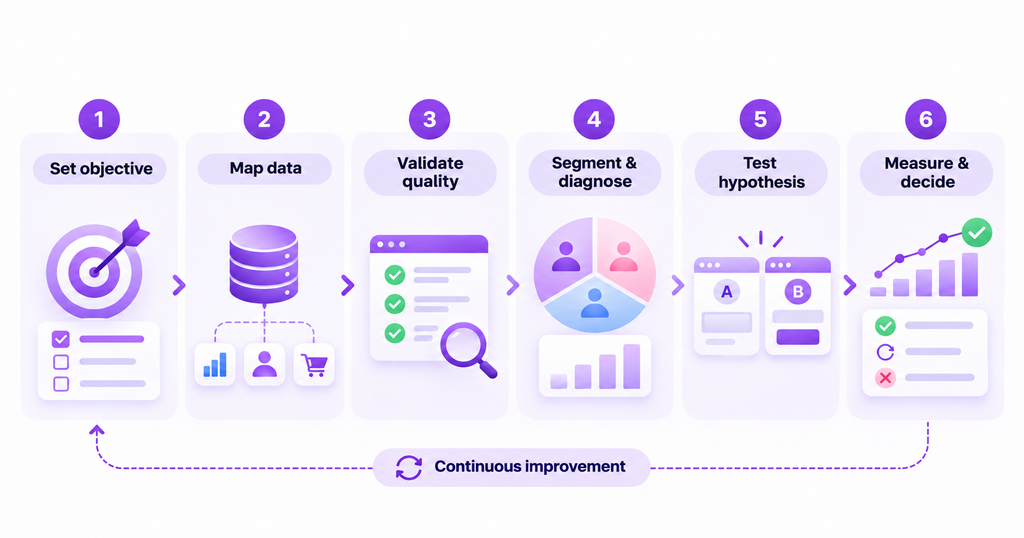
1. Define the business objective and decision
Begin with a business outcome: qualified demos, activated trials, first purchases, repeat revenue, or improved acquisition efficiency. Then identify a concrete decision the team needs to make. For example, should more budget move to paid search, or is the conversion problem actually on the landing page?
Choose a primary outcome, supporting indicators, a comparison period, and a review owner. Avoid changing the definition of success mid-campaign. If a lead is not equivalent to a qualified opportunity, report the two metrics separately rather than blending them into a single success number.
2. Map the minimum data needed
Work backward from the decision. A lead-quality question may require ad spend, landing-page attribution, form submissions, CRM qualification status, and eventual opportunity progression. A checkout question may require product-view, add-to-cart, checkout, and purchase events.
Agree on source naming, event definitions, attribution windows, and how people or accounts can be connected across systems. Use only identifiers you can justify. Incomplete identity stitching, blocked tracking, offline activity, and missing consent will limit what you observe, even with a technically sound setup.
3. Validate quality before interpreting trends
Check whether campaign parameters are consistent, important events fire once, currencies match, and time zones align. Compare analytics results with the source systems where appropriate, noting that different systems may legitimately use different definitions or attribution rules.
If two tools disagree, investigate the underlying data discrepancy before concluding that performance changed. Also check for bot traffic, internal visits, duplicated records, sudden tracking changes, and small samples that make percentage changes look dramatic.
A useful audit records the owner, source, update frequency, metric definition, known blind spots, and remediation status. It does not need to be elaborate to prevent costly misunderstandings.
4. Segment audiences and diagnose patterns
Rather than looking only at the overall conversion rate, compare relevant groups: new versus returning visitors, acquisition channels, customer lifecycle stages, product plans, or campaign cohorts. Examine where changes concentrate and whether those differences persist across a meaningful time window.
Customer segmentation analysis becomes especially useful when a campaign performs well for one audience but poorly for another. Segments should represent meaningful needs or behaviors, not arbitrary slices created because the analytics tool allows them.
Diagnosis also requires alternatives. If mobile conversions declined, possible explanations include slower pages, a tracking break, a changed traffic mix, or genuine friction. Data indicates where to investigate; it rarely identifies the cause on its own.
5. Form a hypothesis and run a controlled test
Write the hypothesis before changing the campaign. A useful format is: “We believe that changing X for audience Y will improve outcome Z because evidence A indicates problem B.” Keep one clear primary metric and a sensible monitoring period.
For example, a B2B landing page attracting relevant visits but few form submissions might test a shorter form or a more specific value proposition. Use an A/B test where feasible, avoid changing several major variables simultaneously, and consider seasonality or audience overlap when interpreting the result.
When randomized testing is unavailable, a structured before-and-after comparison may still reveal useful patterns, but do not present it as proof of causality. Document limitations and look for independent evidence before reallocating substantial spend.
6. Measure, decide, and feed the learning back
Review the primary outcome together with cost, customer quality, and guardrail metrics. A cheaper lead is not necessarily a better result if it converts poorly downstream. Record what changed, what remains uncertain, and whether to adopt, revise, or stop the experiment.
Make the learning visible in a shared decision log. Over time, that connects campaign reporting with planning: successful messages become new tests, weak landing pages receive attention, and spend is allocated to opportunities supported by stronger evidence.
The goal is not to optimize every number every day. It is to build a cycle that consistently produces better decisions.
Data-driven marketing examples across industries
These examples describe plausible workflows, not claimed results from live customer datasets.
SaaS: From traffic volume to qualified trials
A SaaS team sees a rise in visits from an educational keyword cluster while trial activations remain flat. It combines organic landing-page data, signup events, and onboarding milestones to investigate whether the content attracts the wrong audience or whether new users encounter friction after signup.
Instead of judging the cluster by sessions alone, the team tests clearer product examples and a more relevant next step. It then tracks trial starts and activation by landing-page cohort, allowing enough time for users to progress through the funnel.
Ecommerce: Diagnose an expensive acquisition channel
An ecommerce retailer finds that one paid-social campaign has strong engagement but weak purchase completion. It checks product-page engagement, device mix, shipping visibility, and checkout events before deciding whether the creative or the site is responsible.
The team might test a clearer delivery message or revised product imagery. It should evaluate completed orders, margin, and return behavior alongside click-through rates, rather than assuming attractive engagement equals profitable acquisition.
B2B services: Evaluate lead quality, not form volume
A services firm receives leads from several campaigns, but its sales team says many are poor fits. Marketing and sales agree on qualification criteria, then compare channel-level leads with CRM stages and closed opportunities.
This can expose a channel that looks efficient under cost per lead but contributes little qualified pipeline. The next action might be audience refinement, revised positioning, or a more specific landing page, not automatically more advertising.
Personalization: Apply evidence with restraint
A marketer can tailor recommendations using purchase history, expressed preferences, or observed product usage, provided data use is appropriate. Salesforce’s sixth *State of the Connected Customer* research reported that 73% of customers expected better personalization as technology advanced.
That finding describes expectations in the cited survey, not proof that a particular personalization tactic will work. Teams still need to test whether the change improves customer experience and business outcomes without creating privacy or trust concerns.
How to use data to test and improve marketing campaigns
Creative testing is a natural application of data-driven marketing. The goal is not to generate endless variants. It is to investigate which message, format, or offer resonates with a defined audience and whether the improvement persists beyond a vanity metric.
Turn performance questions into creative hypotheses
Start with the signal. If a static advertisement has low engagement but high post-click conversion, the offer may be sound while the creative struggles to win attention. If click-through rate is high but lead quality is poor, the message may be attracting the wrong audience.
Choose one variable to test, such as opening hook, proof point, format, or call to action. Maintain comparable targeting and placements where possible, and evaluate downstream conversions alongside delivery metrics.
Explore video formats without confusing production and measurement
For teams testing motion-based advertising, photo to video AI can help turn a still creative into a short moving variation. Powtoon Text to Video AI can be used to explore an explainer-style treatment of the same core message.
Audio can be another controlled variable. For example, realistic text to speech offers a way to produce a voiceover, while text to speech provides another route for generating spoken variations from written copy.
These are production options, not analytics products. Compare creative quality and brand suitability before testing, and obtain appropriate rights and permissions for assets and voices. Then measure how each version influences qualified actions, not merely how quickly it was produced.
Use a simple experiment register
| Experiment field | What to document |
| Problem | Performance signal that triggered the test |
| Hypothesis | Expected change and the reason behind it |
| Variants | Exactly what differs between versions |
| Primary metric | Conversion or business outcome to improve |
| Guardrails | Quality, cost, trust, or retention indicators |
| Decision | Keep, iterate, pause, or investigate further |
A documented experiment remains useful even when it fails. Knowing that a particular claim or format did not change qualified outcomes can prevent a team from repeating the same ineffective approach.
How to measure data-driven marketing performance
Measurement should reflect the decision under review. A campaign manager deciding how to allocate budget needs different evidence from a product-growth team investigating activation or a B2B leader evaluating pipeline contribution.
| Question | Useful measures | Important limitation |
| Are we reaching people? | Impressions, reach, qualified visits | Exposure does not imply intent |
| Are visitors progressing? | Engagement, key events, funnel completion | Tracking gaps can hide steps |
| Are we acquiring viable customers? | Qualified leads, trial activation, CAC | Lead volume alone can mislead |
| Are we generating value? | Revenue, pipeline, retention, payback | Outcomes may have long delays |
| Which touchpoints receive credit? | First-touch and multi-touch attribution | Credit is model-dependent |
| Did marketing cause extra demand? | Lift tests, experiments, MMM | Needs stronger causal assumptions |
A proper marketing measurement plan defines the metric, denominator, source, attribution window, and decision it supports. When teams compare unlike definitions, a precise-looking dashboard can still produce the wrong answer.
Attribution describes observed journeys
Attribution assigns conversion credit to recorded marketing touchpoints according to a chosen model. First-touch can highlight acquisition origins, while multi-touch models distribute credit across multiple recorded interactions. Neither model reconstructs every untracked exposure or proves which activity caused a purchase.
This is why attributed revenue should be treated as a lens on observed journeys, not a universal truth. Review more than one model where appropriate, understand the chosen lookback window, and avoid confusing attribution changes with changes in actual demand.
Incrementality and marketing mix modeling answer different questions
Incrementality asks what happened because a marketing intervention occurred, compared with what would have happened without it. Randomized holdouts, conversion-lift experiments, or well-designed geographic tests can help estimate that difference, subject to their assumptions and execution.
For broader planning, marketing mix modeling uses aggregate performance and contextual data to estimate how different factors relate to outcomes. Its usefulness depends on model design, input quality, and validation. It complements, rather than automatically replaces, user-level attribution and controlled experiments.
Treat attractive statistics as evidence to investigate
An older Invesp article claims that data-driven personalization produced five to eight times the return on marketing spend. The page does not present enough methodological detail to treat that range as a reliable expectation for a new campaign or as a general law of data-driven marketing.
A more constructive approach is to use measured local baselines and test results. Even a well-supported industry average may not describe a particular audience, creative, channel, or offer.
Common data-driven marketing challenges and mistakes
• More data without a decision: Collecting another dashboard metric will not help unless a team knows which action the metric could change.
• Inconsistent definitions: “Conversion,” “lead,” and “revenue” may mean different things across platforms. Maintain a shared measurement dictionary.
• Low-quality event tracking: Duplicate events, missing identifiers, and changing tags can turn tracking errors into false marketing insights.
• Correlation mistaken for causation: A channel appearing in converting journeys does not prove it created additional demand. Use experiments where practical.
• Personalization without safeguards: Sensitive or unexpected data use can harm customer trust. Apply purpose limitation, appropriate consent, and retention policies.
• Optimization for shallow metrics: Improvements in impressions or clicks may coincide with worse customer quality. Protect the business outcome as the primary objective.
• Overconfident AI summaries: AI-generated analysis can speed exploration but still requires verified metric definitions, source checks, and human review.
Poor data quality has measurable organizational costs. In a 2025 survey of more than 400 US marketers, Adobe reported that about one in seven respondents had experienced financial losses due to poor data quality during the preceding year.
The finding is a reminder to invest in measurement integrity before trusting automated recommendations.
How Usermaven supports data-driven marketing
Usermaven helps teams connect marketing performance with the observed customer journey and conversions. Its core positioning is revenue attribution software, with website and product analytics providing additional context for understanding what happens after acquisition.
Understand sources, journeys, and funnel behavior
Teams can review channel performance, explore observed journeys with customer journey analytics software, and examine conversion paths. Usermaven’s funnel analytics software helps investigate where tracked users leave a defined process, while segments can compare meaningful behavioral groups.
These views can help distinguish an acquisition problem from a post-click experience problem. They still depend on correctly configured events, available identifiers, and the measurement coverage of the workspace.
Connect campaign activity to conversion credit
Usermaven supports marketing attribution models and adjustable attribution windows to analyze how recorded interactions contribute to goals. For B2B teams, connecting marketing activity with relevant pipeline events can move reporting beyond raw lead totals.
Attribution remains model-dependent, so marketers should interpret it alongside qualification, revenue, and, where possible, incrementality evidence rather than treating any one model as a causal verdict.
Investigate recurring changes with Maven AI Agents
Maven AI can explore trends, funnels, attribution, and other analytics through natural-language questions. Its Agents are scheduled analytical investigators that can monitor campaign changes, traffic shifts, funnel drop-offs, product behavior, and content performance against a defined objective.
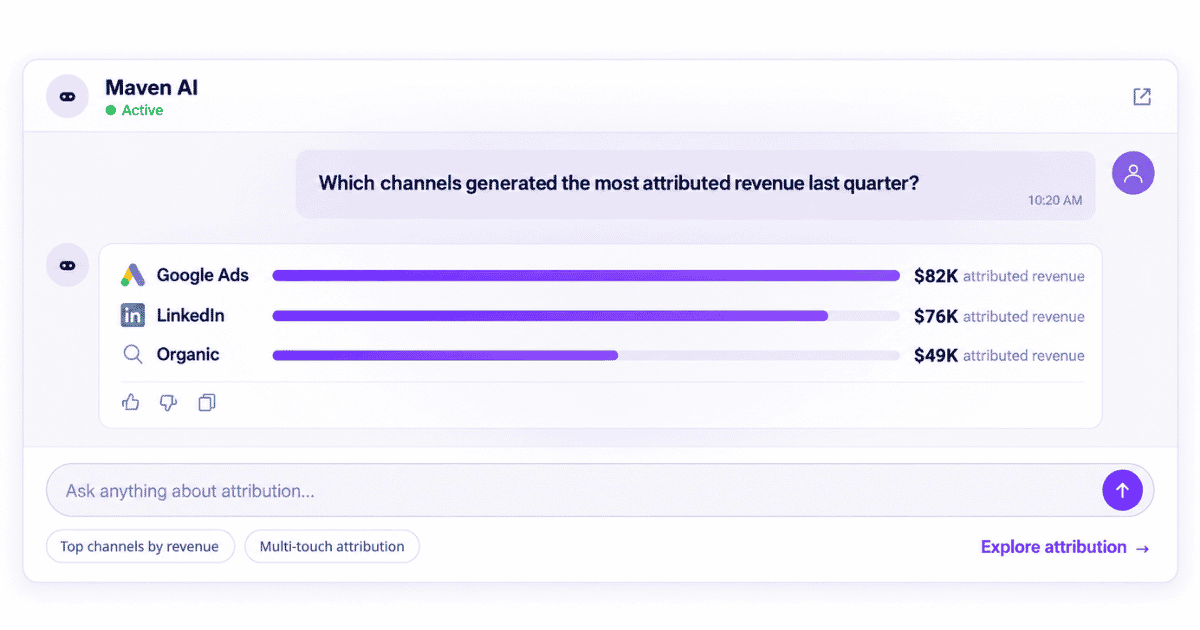
Each Agent run produces findings and an evidence-backed report for review. This is distinct from a scheduled report that repeatedly delivers a predefined view: the Agent investigates its objective and reports what it found.
The October 28, 2026 update also introduced saving Maven AI-generated charts and reports directly to dashboards and sharing Agent reports through public links.
The right workflow remains human-led: verify the result, understand any caveats, decide what to test, and measure the outcome. Usermaven can support that evidence loop without being presented as a replacement for experimentation or enterprise data engineering.
A useful data-driven marketing strategy ends with a decision, not a chart. Start with a clearly defined outcome, examine trustworthy signals, test a practical improvement, and let the result influence the next cycle.
If you want to explore connected customer journeys and multi-touch attribution, book a demo to see how Usermaven fits your measurement workflow.
Data-driven marketing FAQs
What is an example of data-driven marketing?
A SaaS company notices that paid traffic is increasing while activated trials are falling. It compares campaign sources, landing pages, and onboarding events, identifies a possible friction point, tests a revised experience, and checks whether activation improves. The important part is the measured decision cycle, not the dashboard itself.
What are the four types of data analytics used in marketing?
Descriptive analytics explains what happened; diagnostic analytics investigates why it may have happened; predictive analytics estimates what might happen next; and prescriptive analytics recommends possible actions. These categories overlap in real workflows, and predictions or recommendations still require validation.
What tools are used for data-driven marketing?
Common categories include ad-platform reporting, web and product analytics, CRM systems, customer research tools, experimentation platforms, and marketing attribution tools. Choose tools based on the decision and the data connections needed, not the length of the feature list.
How do you start a data-driven marketing strategy?
Pick one business decision, define its primary metric, identify the minimum reliable data, and establish a baseline. Then test one actionable hypothesis, review the result with relevant stakeholders, and document the next decision. Expand the measurement system only where it adds value.
What is the difference between data-driven marketing and marketing analytics?
Marketing analytics is the practice of measuring and interpreting marketing performance. Data-driven marketing is the broader operating approach that uses those analyses, along with research and judgment, to choose actions, run tests, and improve outcomes.
Does data-driven marketing guarantee higher ROI?

Written by
Ryan Mitchell
Marketing Analytics Strategist
Ryan Mitchell is a marketing analytics strategist specializing in campaign measurement, customer journeys, and marketing performance. He writes about analytics, reporting, and data-driven marketing strategies, helping SaaS and B2B teams measure what matters across every stage of the customer journey.
All articles by Ryan →