Analytics is now part of everyday decision-making. Most organisations collect data continuously from systems, websites, transactions, and external sources. The challenge isn’t access anymore. It’s turning constant data flow into decisions people can act on.
That’s where machine learning in analytics earns its place. Instead of relying only on static dashboards and fixed reporting cycles, machine learning helps analytics adapt to changing behaviour and messy real-world conditions.
Done well, it turns analytics into a system that learns, flags what’s shifting, and recommends where to focus so teams can move from information to actionable analytics.
Unlock insights that drive growth
Key takeaways
- Machine learning helps analytics move beyond historical reporting. It identifies patterns in existing data to estimate future outcomes, detect anomalies, and support business decisions.
- Predictive analytics is one of its most useful applications. Businesses can use machine learning to estimate conversion likelihood, customer churn risk, demand, and other outcomes.
- Machine learning can uncover patterns that traditional reporting misses. Techniques such as clustering and anomaly detection help identify customer groups and unusual changes in behavior.
- Reliable data is essential for accurate machine learning analysis. Missing events, inconsistent definitions, and biased training data can reduce the usefulness of predictions.
- Machine learning doesn’t replace human judgment. Teams still need to evaluate predictions, understand limitations, and decide which actions make business sense.
- The best applications connect predictions to measurable outcomes. Whether improving retention, prioritizing leads, or optimizing campaigns, machine learning is most useful when it supports a specific business goal.
How does machine learning work in data analytics?
Machine learning analyzes historical data to identify patterns that can help explain or predict outcomes.
Unlike traditional reporting, which usually follows predefined calculations and rules, machine learning models can learn relationships between different variables.
The process generally involves five steps:
- Collect data: Gather relevant information from sources such as website analytics, CRM systems, product events, and transactions.
- Prepare the data: Remove duplicates, address missing values, standardize formats, and identify relevant features.
- Train a model: Use historical data to help an algorithm learn patterns associated with specific outcomes.
- Evaluate predictions: Test the model on data it hasn’t seen during training to understand its accuracy and limitations.
- Apply and monitor: Use predictions to support decisions, then monitor performance as customer behavior and business conditions change.
For example, a SaaS business might train a model using historical customer activity and cancellation records.
The model could identify that declining product usage, reduced team activity, and repeated onboarding difficulties are associated with higher churn risk.
It could then estimate which current customers are more likely to cancel, helping the customer success team prioritize outreach.
However, these predictions indicate potential risk. They don’t prove why a customer will churn or guarantee that an intervention will prevent it.
How machine learning changes analytics
Traditional analytics is great at answering “what happened?”
Machine learning (ML) pushes further: “What’s likely to happen next, and what should we do about it?”
1) Models learn patterns that rules can’t keep up with
Fixed rules struggle when customer behaviour shifts, seasonality changes, or new products roll out. Machine learning models retrain on historical and recent activity, so predictions update as patterns evolve (rather than staying locked to a single rule set).
2) Predictive signals become visible earlier
Predictive behavioral analytics focuses on signals that appear before outcomes. It evaluates signals like how often users return, how deeply they engage, the order of actions, and where they drop off. This helps teams anticipate conversion, churn risk, and support load while there is still time to act.
3) Analytics moves from explanation to intervention
Predictive models estimate risk and opportunity. Then prescriptive analytics builds on that by comparing possible actions (education, outreach, onboarding changes, pricing tests) and clarifying trade-offs so teams can choose the best response while there’s still time to influence results.
Unlock insights that drive growth
Common machine learning techniques used in analytics
Different machine learning techniques solve different analytics problems. The right approach depends on the data available and the question you’re trying to answer.
| Technique | How it works | Analytics example |
|---|---|---|
| Classification | Predicts which category an observation belongs to | Identifying customers at high or low churn risk |
| Regression | Estimates a numerical value | Forecasting customer lifetime value or future revenue |
| Clustering | Groups similar observations without predefined labels | Discovering customer segments based on behavior |
| Anomaly detection | Identifies unusual patterns or observations | Flagging unexpected conversion drops or transaction spikes |
| Time-series forecasting | Estimates future values using historical patterns | Predicting traffic, demand, or subscription revenue |
Supervised vs. unsupervised learning
Two common approaches are supervised and unsupervised learning.
Supervised learning uses training data with known outcomes. For example, a business can train a churn prediction model using historical customer records labeled as retained or churned.
Unsupervised learning looks for patterns without predefined outcome labels. Customer clustering is a common example, where an algorithm groups users based on similarities in their behavior.
Neither approach is automatically better. Supervised learning is useful when you have reliable historical outcomes, while unsupervised learning helps explore patterns that haven’t been categorized.
The most important consideration is whether the technique produces insights that are accurate, understandable, and useful for the business decision.
Making analytics work smarter in real operations
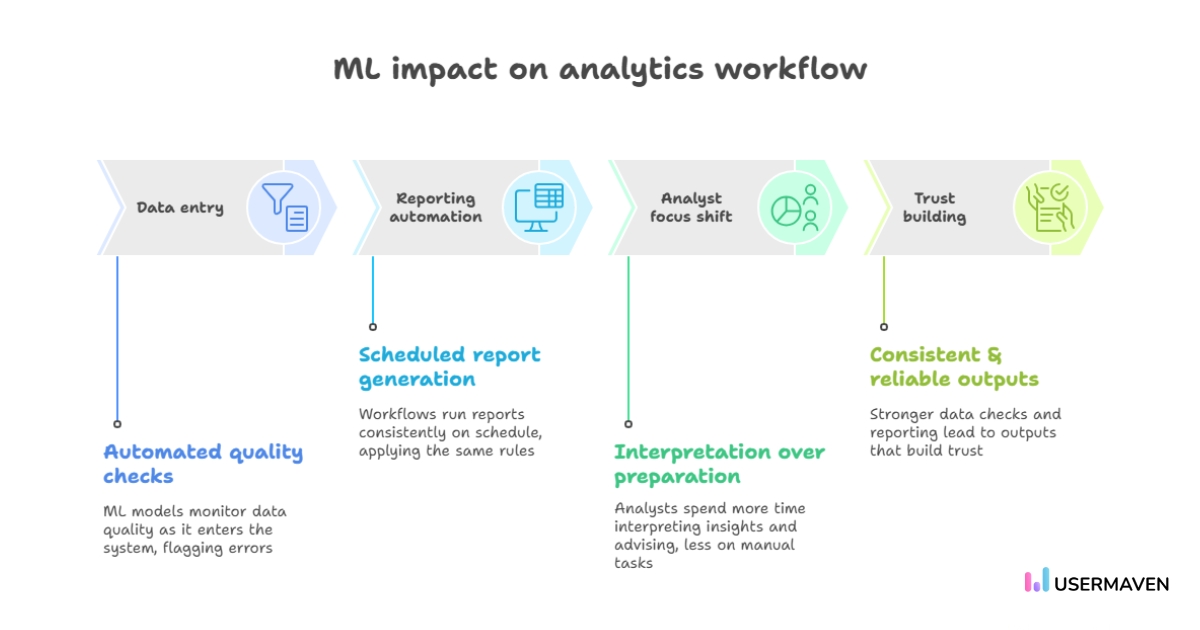
Machine learning doesn’t just “predict stuff.” It removes friction in the analytics pipeline and increases trust in what people see.
Reducing the time spent fixing data
Data prep often takes longer than the analysis itself, especially when teams are dealing with inconsistent formats, missing values, duplicates, and sudden, unexplained spikes.
Machine learning helps by monitoring data quality as data arrives. Anomaly detection models flag unusual values, identify patterns indicative of pipeline errors, and highlight records that require review. Over time, this reduces rework and lowers the chance that decisions are based on flawed data. Paired with strong data checks, teams build confidence that reporting is stable, not fragile.
Improving reporting without manual drag
Many reports use the same structure each week, with only the numbers changing. Automating refresh and validation reduces human error and frees analysts to focus on interpretation.
Machine learning adds another layer: it can automatically detect when “normal” changes like a sudden drop in conversions from a segment that usually performs well, and push that exception to the top of the queue.
Supporting people who rely on timely insight
In service-driven sectors, timely clarity matters. When analytics flags early risks, missed appointments, rising caseload complexity, and delayed follow-ups, teams can support care providers with the right signals at the right time. This improves response without adding reporting pressure to an already stretched staff.
Building trust in the outputs
People use analytics when they trust it. Clean pipelines, consistent definitions, and fewer manual overrides lead to outputs that hold up under scrutiny. Trust isn’t a “soft benefit”; it’s what makes analytics part of real planning instead of a background report.
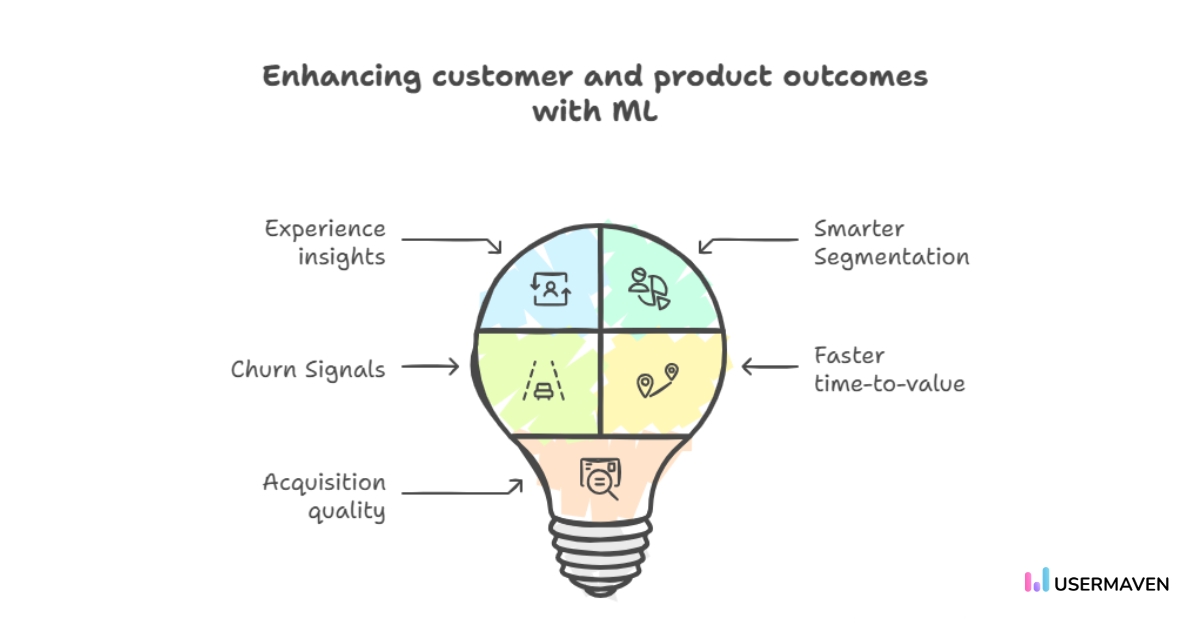
Machine learning for customer and product outcomes
Where machine learning becomes most valuable is when it connects behaviour to outcomes, especially in product-led and subscription businesses.
Connect experience to usage
Customer experience analytics improves when it’s grounded in what customers do, not just what they say. ML can connect qualitative feedback (tickets, NPS comments) with behavioural context (feature paths, friction points). This helps teams see which experiences improve retention and which ones create frustration.
Segment customers by behaviour
Customer segmentation becomes far more useful when it clusters people by behaviour: activation pace, depth of use, collaboration patterns, outcomes achieved, and support needs. Two customers on the same plan can behave completely differently, and ML helps you see that difference early.
Map the path to value
Instead of treating onboarding as one generic checklist, ML can identify which behavioural sequences correlate with long-term value:
- Which actions predict feature adoption
- What behaviour patterns show a user reached the aha moment
- Which steps shorten the time to value
- Where users stall, loop, or drop off
This lets teams redesign onboarding around evidence, not opinion.
Spot churn risk early
Reducing churn works best when it starts before the decision to cancel. ML models track leading indicators such as declining activity, reduced team usage, shortened sessions, stalled workflows, and unresolved support loops. A single change may not mean much, but repeated signals together tell a clear story.
Track acquisition quality over time
Sign-ups alone can be misleading. SaaS attribution software helps connect acquisition sources to what happens next by tracking product usage over time. That makes it easier to see which channels bring customers who activate, adopt key features, and retain, and not just users who convert once.
Example of machine learning in marketing analytics
Consider a B2B SaaS company generating leads through paid advertising, organic search, and email campaigns.
The marketing team can see which channels produce the most leads, but lead volume alone doesn’t reveal which prospects are most likely to become customers.
Machine learning can help analyze historical lead behavior and identify patterns associated with successful conversions.
Here’s how that might work:
| Data input | What machine learning analyzes | Potential insight |
|---|---|---|
| Acquisition channel | Where qualified and unqualified leads originate | Channels associated with higher-quality leads |
| Website activity | Pages visited and engagement patterns | Behaviors associated with conversion |
| Product activity | Feature usage and activation milestones | Signals associated with product adoption |
| CRM data | Lead stages and closed-won outcomes | Patterns associated with successful deals |
| Customer history | Retention and revenue outcomes | Characteristics associated with long-term customer value |
For example, the model might identify that leads who attend a product demo and complete a specific onboarding milestone have a higher historical conversion rate than leads who only visit the pricing page.
The team could use this information to prioritize follow-ups, improve onboarding, or investigate which channels attract prospects with stronger buying intent.
Important: Machine learning identifies statistical relationships. A higher predicted conversion rate doesn’t prove that a particular activity caused the conversion.
To evaluate whether a marketing change actually improves results, teams may also need controlled experiments or other methods designed to estimate incremental impact.
Turning data into decisions (without making it “AI-first”)
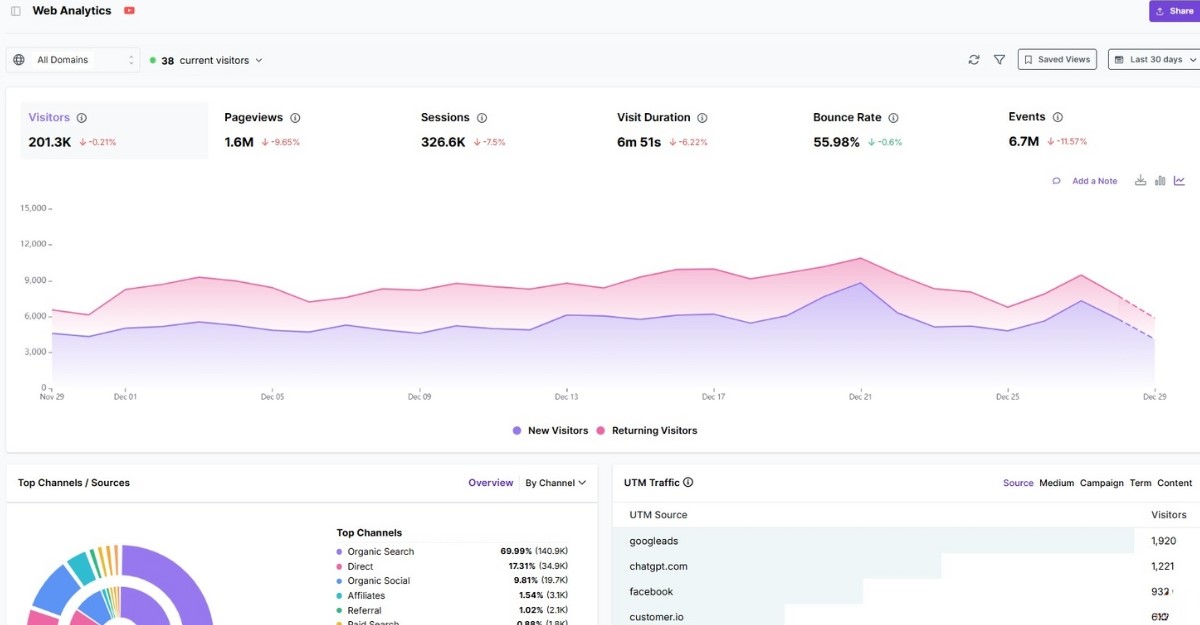
Turn marketing data into actionable insights with Usermaven
Machine learning and AI-powered analysis are most useful when teams can connect insights to actual business outcomes.
For marketing teams, that means understanding more than website visits or campaign engagement. They need to know how prospects move through the customer journey, which channels contribute to conversions, and how those interactions relate to pipeline and revenue.
Usermaven is an AI-powered marketing attribution platform that connects marketing activity, customer journeys, and revenue outcomes.
With Maven AI, teams can ask questions about their marketing performance, investigate changes in conversion trends, and identify areas that need attention.
Maven AI Agents also support recurring analysis, helping teams monitor acquisition performance, conversion funnels, and other marketing outcomes without manually preparing every report.
Combined with multi-touch attribution and funnel analysis, these capabilities help teams investigate performance and make more informed marketing decisions.
AI-generated insights still depend on the quality and completeness of the underlying data. Teams should validate important findings before making significant budget or strategy changes.
Want to understand which marketing activities contribute to business growth? Book a demo to explore Usermaven.
FAQs
1. How does machine learning change the way analytics supports real business decisions?
It shortens the distance between activity and insight. Instead of waiting for end-of-month summaries, teams can detect shifts as they start and then decide while outcomes are still changeable.
2. What data signals does machine learning use to predict churn in SaaS?
Behavioural patterns such as declining login frequency, reduced depth of use, stalled onboarding, shrinking team adoption, slower feature exploration, and unresolved support loops. The model learns the combination of signals that typically precedes churn.
3. How does ML improve onboarding and conversion without guesswork?
By comparing many journeys to identify the actions and sequences that correlate with retention or upgrades. That evidence can guide onboarding changes, prompts, and education so more users reach value faster.
4. What makes machine-learning analytics more dependable than static reporting?
Static reports depend on fixed rules and manual checks. With proper governance, machine learning can continuously validate inputs, detect anomalies, and alert teams when data or behaviour changes.
Updated

Written by
Ryan Mitchell
Marketing Analytics Strategist
Ryan Mitchell is a marketing analytics strategist specializing in campaign measurement, customer journeys, and marketing performance. He writes about analytics, reporting, and data-driven marketing strategies, helping SaaS and B2B teams measure what matters across every stage of the customer journey.
All articles by Ryan →