A campaign produces thousands of clicks, hundreds of conversions, and a low cost per lead. The advertising dashboard looks successful.
The CRM tells a different story. Few leads become qualified opportunities, closed revenue remains low, and many of the customers acquired through the campaign cancel within their first few months.
This difference exists because campaign activity and business impact are not the same thing.
Marketing attribution metrics connect channels, campaigns, and customer touchpoints with outcomes such as qualified pipeline, customers, revenue, and lifetime value.
The right metrics show more than what happened. They explain where credit was assigned, what commercial value resulted, and which marketing decision the result should influence.
This guide covers 18 marketing attribution metrics, their formulas, required data, interpretation limits, and the business questions each one can answer. It also adds recent marketing attribution benchmarks so teams can separate industry context from the internal baselines that should guide day-to-day budget decisions.
Key takeaways
Marketing attribution metrics measure how channels and touchpoints receive credit for conversions, pipeline, revenue, and customer value. They are different from delivery metrics such as impressions, clicks, and sessions.
Revenue, pipeline, efficiency, journey, and customer-value metrics answer different business questions. They should not be combined into one general performance score.
Attribution results can change when the conversion event, model, or attribution window changes, even when the underlying number of customers and total revenue remain the same.
Reliable metrics require connected campaign, website, product, CRM, billing, and customer-identity data. A formula cannot correct incomplete or disconnected inputs.
Marketing attribution benchmarks are most useful when they compare like with like. External benchmarks can show measurement maturity, while internal historical baselines are usually better for channel, CAC, ROAS, pipeline, and LTV decisions.
What are marketing attribution metrics?
Marketing attribution metrics are measurements used to evaluate how marketing channels, campaigns, and customer touchpoints contribute to a defined business outcome.
That outcome may be a:
Signup
Demo request
Qualified lead
Sales opportunity
Purchase
Subscription
Closed deal
Renewal
Expansion
The metric describes one part of the result. The attribution model determines how credit is assigned to the interactions that preceded it. For the full setup process behind these calculations, see the guide on how to measure marketing attribution across campaigns, touchpoints, conversions, and revenue.

For example, attributed revenue shows how much revenue a channel receives under the selected model. Time to conversion shows how long the journey lasted. Assisted conversion rate measures how frequently a channel participated without receiving final credit.
Marketing metrics vs. attribution metrics
General marketing metrics describe activity and behavior. Attribution metrics connect that activity with a later outcome.
The difference becomes clearer when marketing analytics and attribution are compared directly.
| Metric type | Main question | Examples |
|---|---|---|
| Campaign delivery metrics | What did the campaign deliver? | Impressions, reach, clicks, spend |
| Behavioral metrics | What did visitors do? | Sessions, page views, events, engagement |
| Conversion metrics | Which outcomes occurred? | Signups, demos, purchases |
| Attribution metrics | Which interactions receive credit? | Attributed revenue, assisted conversions |
| Commercial metrics | What business value resulted? | Pipeline, revenue, CAC, LTV |
A paid campaign can produce strong click-through and conversion rates while still generating weak pipeline or low-value customers.
That is why general digital marketing metrics and KPIs should be evaluated alongside attribution and commercial outcomes rather than used as substitutes for them.
Marketing attribution metrics at a glance
The table below summarizes the 18 metrics covered in this guide. Once the metrics are defined consistently, benchmarks can add context by showing how measurement practices compare with peers and how current performance compares with the company’s own historical baseline.
| Metric | Formula or measurement | Primary use |
|---|---|---|
| Attributed revenue | Revenue × assigned credit | Channel contribution |
| Marketing-sourced revenue | Revenue from marketing-originated customers | Demand creation |
| Marketing-influenced revenue | Revenue involving marketing interactions | Journey influence |
| Revenue per customer by channel | Channel revenue ÷ customers | Customer value |
| ROAS | Attributed ad revenue ÷ ad spend | Paid-media efficiency |
| Marketing ROI | Net attributed return ÷ marketing cost | Financial return |
| CAC by channel | Channel cost ÷ customers | Acquisition efficiency |
| Cost per attributed conversion | Spend ÷ attributed conversions | Campaign comparison |
| Marketing-sourced pipeline | Opportunity value sourced by marketing | B2B acquisition |
| Marketing-influenced pipeline | Pipeline touched by marketing | B2B influence |
| Win rate by source | Won opportunities ÷ opportunities | Lead quality |
| Average deal value by source | Closed revenue ÷ closed customers | Account value |
| Conversion rate by source | Conversions ÷ eligible audience | Source quality |
| Assisted conversion rate | Assisted conversions ÷ total conversions | Supporting influence |
| Touchpoints per conversion | Touchpoints ÷ conversions | Journey complexity |
| Time to conversion | Conversion date − first interaction | Sales-cycle length |
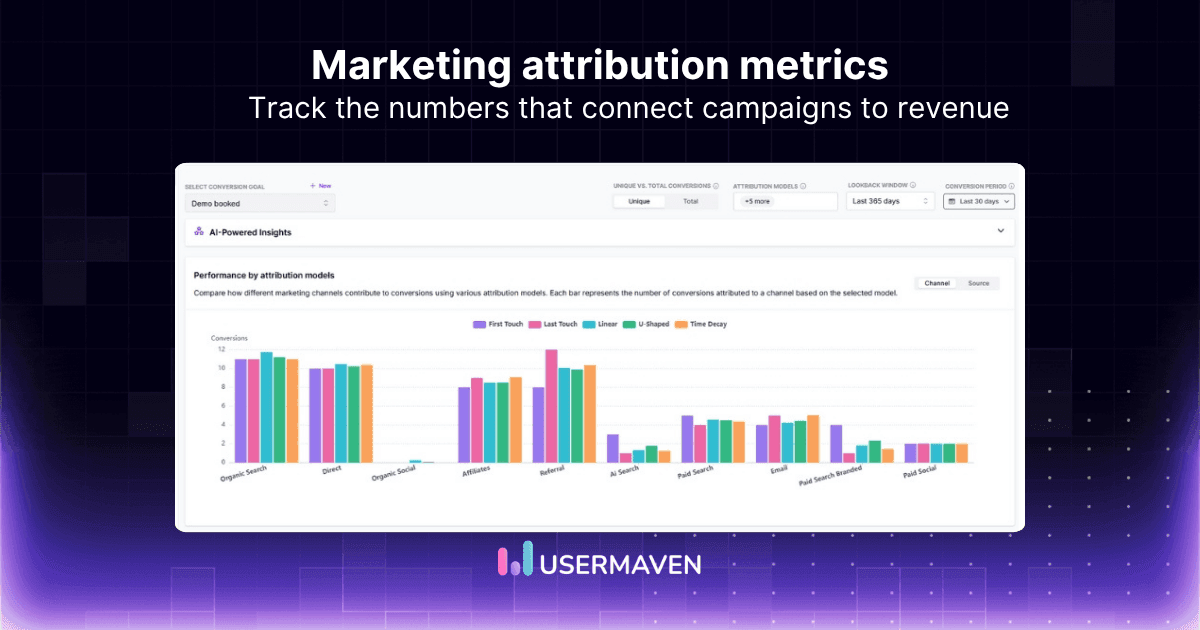
| Attribution credit by model | Credit received under each model | Model comparison |
| LTV by source | Customer lifetime value grouped by source | Long-term quality |
Marketing attribution benchmarks
Marketing attribution benchmarks provide context for the metrics in an attribution report. They can show how other teams measure marketing, which attribution approaches are common, and whether an internal result is improving or falling behind a relevant baseline.
The important distinction is that a benchmark is not automatically a target. A peer benchmark can help assess measurement maturity, while a company-specific target should still reflect margins, sales cycle, average contract value, channel mix, and growth strategy.
What is a marketing attribution benchmark?
A marketing attribution benchmark is a reference point used to compare an attribution metric, measurement practice, or model against a relevant baseline. The baseline may come from the company’s own history, a comparable customer cohort, or external industry research.
| Term | Meaning | Example |
|---|---|---|
| Attribution metric | The result being measured | Attributed revenue, ROAS, sourced pipeline, LTV |
| Benchmark | The reference point used for comparison | Last quarter, peer companies, mature customer cohorts |
| Target | The result the business wants to achieve | $1M sourced pipeline or CAC below $500 |
Metrics answer “what happened?” Benchmarks answer “compared with what?” Targets answer “what result are we trying to reach?” Keeping those three concepts separate prevents an external industry average from being treated as a universal performance goal.
Recent B2B marketing attribution benchmarks
Recent B2B research shows that attribution practices are becoming more sophisticated, but measurement remains uneven. The most useful figures describe what teams measure and how they assign credit rather than pretending there is one universal “good” ROAS, CAC, or win rate.
| Benchmark | Recent finding | What it suggests |
|---|---|---|
| Sourced + influenced attribution | 57% of marketers use both | Mature B2B reporting increasingly separates origin from later influence |
| Marketing ROI measurement | 90% report marketing ROI | Financial contribution is widely expected even when attribution methods differ |
| Attribution-model preference | Multi-touch is used more often than first- or last-touch | Teams increasingly want more than one-touch credit |
| Pipeline generated | 62% rank it among their top marketing performance metrics | Pipeline remains a primary B2B marketing outcome |
| Opportunities generated | 51% | Opportunity creation is another common commercial benchmark |
| New ARR bookings | 36% | Fewer teams use booked revenue as a top-three marketing metric |
| Marketing cost per $ of pipeline | 52% measure it | Efficiency measurement still trails topline pipeline reporting |
| Marketing cost per $ of new-logo ARR | 46% measure it | Less than half directly connect marketing cost with new-logo revenue efficiency |
The sourced-versus-influenced and ROI findings come from 6sense’s B2B marketing attribution benchmark. Its research also reports that multi-touch attribution is now more common than first- or last-touch among marketers using sourced attribution.
The pipeline, opportunity, ARR, and efficiency figures come from Benchmarkit’s B2B marketing benchmarks. These studies describe B2B measurement practices, so they should not be presented as universal performance targets for ecommerce, consumer apps, or other business models.
For B2B teams, benchmark interpretation should also account for buying committees, CRM opportunity stages, and long conversion cycles. A B2B marketing attribution framework is more useful when those account-level outcomes are separated from lead volume.
Attribution model adoption by company size
Benchmarkit’s 2025 research also shows that multi-touch attribution adoption varies by company size. Adoption is not perfectly linear across smaller and mid-market segments, but it rises sharply in the largest revenue group reported.
| Company revenue | Using multi-touch attribution |
|---|---|
| Under $5M | 44% |
| $5M-$20M | 40% |
| $20M-$50M | 38% |
| $50M-$100M | 33% |
| $100M-$250M | 42% |
| $250M-$1B | 73% |
The underlying Benchmarkit attribution-model data also shows first-touch, last-touch, and inbound approaches remaining in use. The practical lesson is not that every company should copy the largest segment. It is that attribution tends to become more complex as revenue scale, channel mix, and measurement requirements expand.
Not every attribution metric has a useful industry benchmark
Metrics such as ROAS, CAC, win rate, deal size, time to conversion, and LTV can vary dramatically by business model. A 4× ROAS may be attractive for one company and unprofitable for another because gross margin, repeat purchase behavior, sales costs, and payback expectations are different.
The same problem applies to B2B benchmarks. A 90-day sales cycle may be efficient for a six-figure enterprise contract and unacceptable for a low-ACV self-serve product. Benchmarks should therefore match the economic and journey context of the metric being compared.
What should each attribution metric be benchmarked against?
| Metric | Better benchmark | Why |
|---|---|---|
| Attributed revenue | Historical channel contribution + revenue plan | Credit depends on the chosen model and business target |
| ROAS | Margin requirements + historical campaign ROAS | Revenue alone does not show profitability |
| Marketing ROI | Required business return + comparable programs | Cost definitions and return definitions vary |
| Channel CAC | LTV, payback target, and mature channel cohorts | A lower CAC is not useful if customer quality is weak |
| Sourced pipeline | Pipeline target + historical source mix | Pipeline needs differ by quota, ACV, and win rate |
| Influenced pipeline | Mature opportunity cohorts using the same influence rule | Participation definitions can inflate totals |
| Win rate | Same source, segment, ACV, and opportunity stage | Mixed cohorts can hide quality differences |
| Time to conversion | Median by customer type and conversion goal | Sales-cycle length changes by segment and outcome |
| Touchpoints per conversion | Similar journey and customer segment | Observable journey complexity varies by buying process |
| LTV by source | Mature acquisition cohorts using one LTV definition | Retention and expansion take time to develop |
External vs. internal attribution benchmarks
External benchmarks are most useful for comparing measurement maturity, model adoption, and broad peer practices. They can show whether a team is still relying on one-touch reporting while comparable organizations have moved toward sourced-and-influenced or multi-touch analysis.
Internal benchmarks are usually more useful for operating decisions. Compare current ROAS, CAC, pipeline, win rate, conversion time, and LTV with prior periods or comparable internal cohorts using the same model, window, and conversion definition.
Practical rule: external benchmarks tell you how other companies measure; internal benchmarks tell you whether your own marketing is improving.
With that benchmark context established, the next sections return to the 18 attribution metrics themselves and explain how to calculate, interpret, and use each one consistently.
18 marketing attribution metrics to track
The metrics are grouped by the decisions they support.
Revenue attribution metrics explain financial contribution. Efficiency metrics compare results with cost. Pipeline metrics evaluate B2B opportunity creation, while journey metrics show how customers progress toward conversion.
With the measurement and benchmark context defined, the first group focuses on how marketing receives credit for revenue and customer value.
Revenue attribution metrics
1. Attributed revenue
Attributed revenue is the amount of revenue assigned to a channel, campaign, content asset, or touchpoint under a selected attribution model.
Formula
Attributed revenue = Total revenue × attribution credit percentage
Suppose a customer completes a $10,000 purchase after interacting with paid search, an organic article, and an email campaign.
If the selected model gives paid search 40% of the credit, paid search receives $4,000 in attributed revenue.
Data required
- Recorded customer touchpoints
- Conversion or transaction identity
- Revenue value
- Attribution model
- Attribution window
Decision supported
Attributed revenue helps compare the financial contribution assigned to channels and campaigns.
Interpretation warning
Changing the attribution model can redistribute credited revenue without changing actual total revenue.
A reliable revenue attribution system should therefore show both total business revenue and the model used to distribute channel credit.
2. Marketing-sourced revenue
Marketing-sourced revenue measures revenue from customers whose recorded journey originated through an eligible marketing interaction.
Measurement
Revenue from customers with a marketing-sourced first interaction
A company may classify a customer as marketing sourced when the first known interaction came from:
- Paid advertising
- Organic search
- Content
- Affiliate marketing
- Social media
- A webinar
- A partner campaign
Decision supported
This metric helps evaluate marketing’s role in creating new demand.
Interpretation warning
The definition of “marketing sourced” must remain consistent across the attribution platform and CRM.
If the CRM uses lead creation as the starting point while the attribution system includes anonymous activity, the two reports may disagree.
3. Marketing-influenced revenue
Marketing-influenced revenue measures revenue from customers or opportunities that interacted with marketing at any eligible stage of the journey.
Measurement
Revenue from deals containing one or more eligible marketing interactions
A deal may be sales sourced but still influenced by:
- A product webinar
- A comparison page
- A retargeting campaign
- A case study
- A sales-nurture email
- An industry event
Decision supported
This metric helps show marketing’s wider contribution to long and multi-stakeholder journeys.
Interpretation warning
Influenced revenue should not be described as revenue generated exclusively by marketing.
A single deal may be influenced by several campaigns, so influenced totals can exceed actual revenue when each interaction receives full participation credit.
4. Revenue per customer by channel
Revenue per customer by channel measures the average revenue generated by customers attributed to a specific source.
Formula
Revenue per customer by channel = Channel revenue ÷ customers attributed to the channel
Suppose organic search generates 40 customers and $80,000 in revenue. Paid social generates 70 customers and $70,000.
Organic search produces fewer customers but twice as much revenue per customer:
- Organic search: $2,000 per customer
- Paid social: $1,000 per customer
Decision supported
This metric helps compare customer value across acquisition channels.
Interpretation warning
Use the same revenue period for every channel. Comparing one channel’s first-payment revenue with another channel’s annual revenue will produce misleading results.
Spend and efficiency metrics
5. Return on ad spend
Return on ad spend measures the revenue attributed to advertising relative to the amount spent on those advertisements.
Formula
ROAS = Attributed advertising revenue ÷ advertising spend
A campaign that generates $20,000 in attributed revenue from $5,000 in advertising spend has a ROAS of:
$20,000 ÷ $5,000 = 4
The campaign generated $4 in attributed revenue for every $1 spent.
Decision supported
ROAS supports paid-channel, campaign, audience, and creative optimization.
Interpretation warning
ROAS is not the same as profit. It does not automatically include salaries, agency fees, production costs, product costs, or overhead.
The full guide to calculating ROAS explains how advertising revenue and spend should be defined before campaign results are compared.
6. Marketing ROI
Marketing return on investment measures the financial return remaining after marketing costs are deducted.
Formula
Marketing ROI = (Attributed return − marketing cost) ÷ marketing cost × 100
Suppose a campaign produces $50,000 in attributed return and costs $20,000.
($50,000 − $20,000) ÷ $20,000 × 100 = 150%
The campaign produced a 150% return relative to its cost.
HubSpot notes that marketing ROI calculations should clearly identify the campaign cost and the financial return used in the calculation. Its guidance also recommends accounting for costs such as production, promotion, and labor when relevant. HubSpot’s marketing ROI guide provides examples of how these inputs affect the final result.
Decision supported
Marketing ROI helps evaluate the financial performance of broader campaigns and programs.
Interpretation warning
Document whether “return” represents revenue, gross profit, or contribution margin. Revenue-based ROI can overstate performance when direct costs are substantial.
7. Customer acquisition cost by channel
Customer acquisition cost by channel measures the average marketing and sales expense required to acquire a customer from a specific source.
Formula
Channel CAC = Channel marketing and sales cost ÷ new customers attributed to the channel
Suppose a channel costs $30,000 and generates 60 new customers.
$30,000 ÷ 60 = $500 CAC
Data required
- Advertising spend
- Campaign and content costs
- Relevant sales costs
- New-customer count
- Attribution source
Decision supported
Channel CAC helps compare acquisition efficiency and budget sustainability.
Interpretation warning
Customers, not leads, trials, or demo requests, should be used as the denominator when calculating customer acquisition cost.
The average customer acquisition cost should also be evaluated alongside customer value and payback period.
8. Cost per attributed conversion
Cost per attributed conversion measures the average spend required to produce a conversion credited to a channel or campaign.
Formula
Cost per attributed conversion = Channel spend ÷ attributed conversions
Suppose a campaign costs $8,000 and receives credit for 160 qualified conversions.
$8,000 ÷ 160 = $50 per attributed conversion
Decision supported
This metric supports short-term campaign and audience optimization.
Interpretation warning
The selected conversion must represent a meaningful outcome.
A $10 cost per signup may look better than a $60 cost per activated user, but the activated-user metric may be much more closely connected with revenue.
Pipeline attribution metrics
9. Marketing-sourced pipeline
Marketing-sourced pipeline is the total potential value of opportunities that originated through eligible marketing activity.
Measurement
Sum of opportunity values sourced by marketing
Suppose marketing generates 15 opportunities with a combined value of $600,000. The marketing-sourced pipeline is $600,000.
Decision supported
This metric helps B2B companies evaluate whether marketing creates commercially meaningful sales opportunities.
Interpretation warning
Pipeline represents potential revenue, not closed revenue.
Opportunity values can change, deals can be lost, and expected revenue may never be collected.
A complete B2B marketing attribution framework should report sourced pipeline, won revenue, and win rate separately.
10. Marketing-influenced pipeline
Marketing-influenced pipeline measures the value of active opportunities that interacted with marketing during their journey.
Measurement
Sum of opportunity values containing eligible marketing interactions
An opportunity may be sourced through outbound sales but later interact with webinars, content, email, and retargeting.
That activity can qualify the opportunity as marketing influenced even though marketing did not create the initial contact.
Decision supported
This metric helps explain marketing’s role in nurturing and accelerating active opportunities.
Interpretation warning
Sourced and influenced pipeline answer different questions:
- Sourced pipeline measures origin.
- Influenced pipeline measures participation.
They should not be merged into one number.
11. Win rate by source
Win rate by source measures the percentage of opportunities associated with a source that become customers.
Formula:
Win rate by source = Closed-won opportunities from source ÷ total opportunities from source × 100
Suppose partner referrals create 20 opportunities and eight close.
8 ÷ 20 × 100 = 40% win rate
Paid social may create more opportunities but close at a lower rate.
Decision supported:
This metric helps identify channels that generate commercially qualified opportunities rather than just leads.
Interpretation warning:
Compare mature opportunity cohorts. Recently created opportunities may not have had enough time to close.
12. Average deal value by source
Average deal value by source measures the average closed revenue generated by customers associated with a particular channel.
Formula:
Average deal value by source = Closed revenue from source ÷ closed customers from source
Suppose events generate $500,000 from ten closed customers.
$500,000 ÷ 10 = $50,000 average deal value
Organic search may generate more customers but a lower average deal size.
Decision supported:
This metric distinguishes high-volume acquisition sources from sources that produce larger accounts.
Interpretation warning:
Use closed revenue rather than open pipeline values, and separate recurring subscription value from total contract value when necessary.
Conversion and customer-journey metrics
13. Conversion rate by source or touchpoint
Conversion rate by source measures the percentage of eligible visitors, leads, users, or accounts that complete the selected outcome.
Formula:
Conversion rate = Attributed conversions ÷ eligible visitors, leads, users, or accounts × 100
Suppose 2,000 visitors arrive through organic search and 100 start a trial.
100 ÷ 2,000 × 100 = 5% conversion rate
Decision supported:
This metric helps compare source quality and funnel performance.
Interpretation warning:
The denominator must remain consistent.
A visitor-to-signup rate cannot be compared directly with a lead-to-customer rate. Both are conversion rates, but they measure different stages.
A documented conversion tracking framework should define the event, audience, counting method, and attribution rules used in the calculation.
14. Assisted conversion rate
Assisted conversion rate measures how frequently a channel participates in a conversion journey without receiving the final conversion credit.
Formula:
Assisted conversion rate = Conversions assisted by channel ÷ total conversions × 100
Suppose email participates in 240 of 600 conversions but is the final interaction for only 70.
Its assisted conversion rate is:
240 ÷ 600 × 100 = 40%
Decision supported:
This metric helps evaluate channels that nurture, educate, or support conversion.
These may include:
Email
Organic social
Webinars
Educational content
Communities
Review platforms
Interpretation warning:
A high assisted rate does not mean the channel should receive all the revenue credit.
It shows participation, while a multi-touch attribution model determines how much credit each interaction receives.
15. Touchpoints per conversion
Touchpoints per conversion measures the average number of recorded interactions that occur before the selected conversion.
Formula:
Touchpoints per conversion = Total pre-conversion touchpoints ÷ total conversions
Suppose 500 customers complete 3,500 recorded interactions before purchasing.
3,500 ÷ 500 = 7 touchpoints per conversion
Decision supported:
This metric helps estimate journey complexity and the amount of nurturing required.
A rising number can indicate:
Longer consideration
More stakeholder involvement
Increased research
Greater channel fragmentation
Added conversion friction
Interpretation warning:
Only observable interactions are counted.
Word of mouth, private messages, offline conversations, and untracked device activity may be absent.
Use conversion path analysis to examine the sequence and role of the interactions rather than relying only on the average count.
16. Time to conversion
Time to conversion measures the duration between the first eligible interaction and a defined conversion event.
Formula:
Time to conversion = Conversion timestamp − first eligible interaction timestamp
A prospect first visits on January 5 and becomes a customer on February 19.
The time to conversion is 45 days.
Decision supported:
This metric helps determine:
Attribution windows
Campaign evaluation periods
Sales-cycle expectations
Retargeting duration
Cohort maturity
Google Ads explains that recent campaign performance can appear weaker while delayed conversions are still being reported. Its guidance recommends examining the typical conversion delay before evaluating results or selecting a reporting period. Google’s conversion-delay guidance also shows how late conversions can affect reported cost per conversion and ROAS.
Interpretation warning
Time to signup, time to opportunity, time to purchase, and time to renewal are separate metrics. The chosen attribution window should match the outcome being evaluated.
Model-comparison and customer-value metrics
17. Attribution credit by model
Attribution credit by model compares the share of conversion or revenue credit a channel receives under different attribution models.
A channel can receive substantially different credit under:
First-click
Last-click
Linear
Time-decay
U-shaped
Data-driven models
For example, organic content may receive strong first-click credit because it introduces prospects.
Branded search may receive strong last-click credit because it appears near the final conversion.
Measurement:
Channel credit under Model A compared with channel credit under Model B
Decision supported:
This metric helps identify whether a channel primarily:
Creates demand
Assists consideration
Re-engages prospects
Captures existing demand
Supports conversion
Interpretation warning:
The model changes the distribution of credit, not the underlying number of customers or total revenue.
The guide to marketing attribution models explains how the common credit rules differ and when each view is most useful.
18. Customer lifetime value by source
Customer lifetime value by source groups long-term customer value according to acquisition source, campaign, or attributed journey.
Measurement:
Average customer lifetime value grouped by source
Suppose paid search and referrals each generate 100 customers.
Paid-search customers produce an average lifetime value of $1,500, while referral customers produce $3,200.
A first-purchase report may make the channels look similar. LTV reveals a substantial difference in long-term quality.
Decision supported:
This metric helps identify sources that produce durable and expandable customer relationships.
Interpretation warning:
Lifetime value is partly based on historical behavior and assumptions about retention, revenue, or margin.
Use consistent calculation rules when comparing sources, and review the guide to calculating SaaS LTV when recurring subscriptions are involved.
Which attribution metrics matter by business goal?
The best metric depends on the decision being made.
| Business goal | Primary metrics |
|---|---|
| Measure demand creation | Marketing-sourced revenue, first-click contribution |
| Optimize paid media | ROAS, cost per attributed conversion, channel CAC |
| Evaluate B2B marketing | Sourced pipeline, influenced pipeline, win rate |
| Measure financial return | Attributed revenue, sourced revenue, marketing ROI |
| Understand customer journeys | Assisted conversion rate, touchpoints, time to conversion |
| Evaluate customer quality | Revenue per customer, CAC, LTV by source |
| Compare attribution models | Attribution credit by model |
The same principle applies to benchmarking: compare each goal with the metric and baseline that match the decision. Demand-creation benchmarks should not be substituted for paid-media efficiency or customer-value benchmarks.
Measuring demand creation
Use sourced revenue, sourced pipeline, and first-click contribution to identify which channels introduce new prospects.
These metrics are most useful for:
Non-branded search
Educational content
Paid social
Partnerships
Events
Communities
Optimizing paid media
ROAS, cost per attributed conversion, and channel CAC help compare advertising efficiency at different stages.
A campaign may have:
Low cost per signup
Average cost per activated user
High CAC
Weak LTV
The metric closest to the business goal should guide optimization.
Evaluating B2B marketing
B2B teams should prioritize:
Marketing-sourced pipeline
Marketing-influenced pipeline
Win rate by source
Average deal value
Closed revenue
Lead volume alone cannot show whether a campaign produces qualified and valuable accounts. A B2B SaaS analytics framework should connect those leads with account activity, pipeline, and closed revenue.
Understanding customer journeys
Assisted conversions, touchpoints per conversion, and time to conversion reveal how much interaction occurs before an outcome.
These metrics are particularly useful when prospects move across:
Content
Advertising
Email
Webinars
Review platforms
Product trials
Sales conversations
Measuring customer quality
CAC, revenue per customer, retention, and LTV help distinguish acquisition volume from customer value. A cohort analysis can show whether customers from different acquisition sources remain active over time.
A channel should not be considered successful only because it produces the most first-time conversions.
How attribution models change metric results
Attribution models decide how conversion and revenue credit is distributed. The total number of recorded conversions should usually remain unchanged. What changes is the share assigned to each interaction.

First-click attribution
First-click attribution gives all credit to the source that introduced the customer.
It is useful for measuring demand creation but ignores nurturing and closing interactions.
Last-click attribution
Last-click attribution gives all credit to the final recorded interaction.
It helps measure demand capture but can overvalue direct traffic, branded search, retargeting, and conversion-stage pages.
Linear attribution
Linear attribution divides credit evenly among all eligible interactions.
It recognizes the whole journey but assumes every touchpoint made the same contribution.
Time-decay attribution
Time-decay attribution gives more credit to interactions closer to conversion.
It can be useful for longer journeys where recent interactions may have greater influence, but it reduces the credit assigned to initial discovery.
Position-based attribution
The U-shaped attribution model is a common position-based approach that gives greater weight to selected milestones, often the first and final interactions.
They recognize both acquisition and conversion but may underweight the middle of the journey.
Data-driven attribution
Data-driven attribution uses observed patterns to calculate relative credit.
Its usefulness depends on the quality, volume, and completeness of the underlying data.
Metrics calculated under different models should always identify the model used. A first-click ROAS value should not be compared directly with a last-click ROAS value without explaining the change in credit rules.
How to calculate marketing attribution metrics accurately
Accurate attribution requires more than applying formulas to a dashboard export. A dependable SaaS marketing attribution strategy or ecommerce framework should define the conversion, data sources, model, window, and system of record before results are compared.

Establish a baseline before benchmarking performance
Before comparing a metric with an external benchmark, calculate a stable internal baseline using one conversion definition, attribution model, window, and reporting period. Otherwise, a change in measurement rules can look like a change in marketing performance.
Use mature cohorts and like-for-like periods where possible. Once the internal baseline is stable, external marketing attribution benchmarks can help evaluate measurement maturity or provide planning context without replacing the company’s own unit economics.
Define the conversion event
Decide which outcome the metric evaluates:
Signup
Demo request
Activated user
Qualified lead
Opportunity
Purchase
Subscription
Closed revenue
Renewal
Changing the conversion event changes the meaning of every downstream metric.
A channel can perform strongly for signups and poorly for paid subscriptions.
Connect the required data
Marketing attribution metrics may require data from:
Advertising platforms
Website analytics
Product analytics
Marketing automation
CRM software
Billing platforms
Ecommerce systems
Finance records
The systems should be connected through consistent customer, account, deal, and transaction identifiers. For SaaS teams, consistent product metrics help connect acquisition sources with activation, adoption, and retention.
Standardize campaign and event definitions
Use consistent:
Source names
Medium names
Campaign names
Event names
Conversion values
User IDs
Account IDs
Deal IDs
Revenue fields
Consistent UTM parameters are especially important when traffic is distributed across advertising, email, affiliates, partnerships, and content.
Select the attribution model
Document which model determines the credit:
First-click
Last-click
Linear
Time-decay
Position-based
Data-driven
Custom
Do not switch models without labeling the report or preserving a comparison view.
Select the attribution window
Document how long an interaction remains eligible for credit.
The window should reflect:
The conversion event
The buying cycle
The product category
The typical time to conversion
The reporting purpose
Short windows can remove early discovery interactions. Extremely long windows can assign credit to interactions that are no longer relevant.
Reconcile against the system of record
Compare attribution totals with the platform responsible for the underlying outcome.
| Outcome | Likely system of record |
|---|---|
| Advertising spend | Advertising platform |
| Website conversion | Analytics or backend |
| Product activation | Product database |
| Opportunity value | CRM |
| Subscription payment | Billing platform |
| Recognized revenue | Finance system |
Attribution should distribute credit for known conversions and revenue. It should not create additional outcomes beyond the source-of-truth totals.
The complete guide to measuring marketing attribution provides the broader implementation process behind these calculations.
Common mistakes when tracking attribution metrics
Reporting conversions without revenue context
A high-converting campaign may produce low-value or unqualified customers.
Evaluate later outcomes such as pipeline, revenue, retention, or LTV before increasing the budget.
Comparing metrics calculated under different models
A first-click ROAS report and a last-click ROAS report use different credit distributions.
Label the model and window beside every attribution metric.
Mixing sourced and influenced pipeline
Sourced pipeline measures where opportunities began.
Influenced pipeline measures whether marketing participated later. Combining them obscures both results.
Ignoring the attribution window
A short window may remove discovery interactions before longer journeys convert.
Time-to-conversion data should guide the selected lookback period.
Adding platform-reported conversions together
Google, Meta, LinkedIn, and other platforms can claim overlapping conversions.
Adding their totals can produce more conversions than the company actually recorded.
Review ad platform discrepancies before using self-reported conversion totals for cross-channel decisions.
Ignoring reporting differences between systems
Advertising, analytics, CRM, billing, and finance platforms can use different:
Identities
Attribution windows
Counting rules
Reporting dates
Revenue fields
Conversion definitions
These marketing attribution discrepancies between tools should be reconciled before channel performance is compared.
Treating attribution as causality
Attribution assigns credit across observed interactions.
It does not prove that a campaign created a conversion that would not otherwise have occurred.
Controlled tests and incrementality methods are required to estimate causal impact.
See what's working. Fix what's not. Grow faster.
*No credit card required
How Usermaven measures marketing attribution metrics
Usermaven connects marketing attribution with website activity, product behavior, customer journeys, CRM pipeline, and revenue.
This allows teams to evaluate channel performance using one connected measurement environment instead of reconciling isolated advertising, analytics, and CRM reports.

Connect paid and organic acquisition
Usermaven can compare acquisition from:
Paid advertising
Organic search
Email
Referrals
Social media
Affiliates
Direct traffic
Content
Channel and source reporting can be viewed alongside conversion and revenue values.
Track complete customer journeys
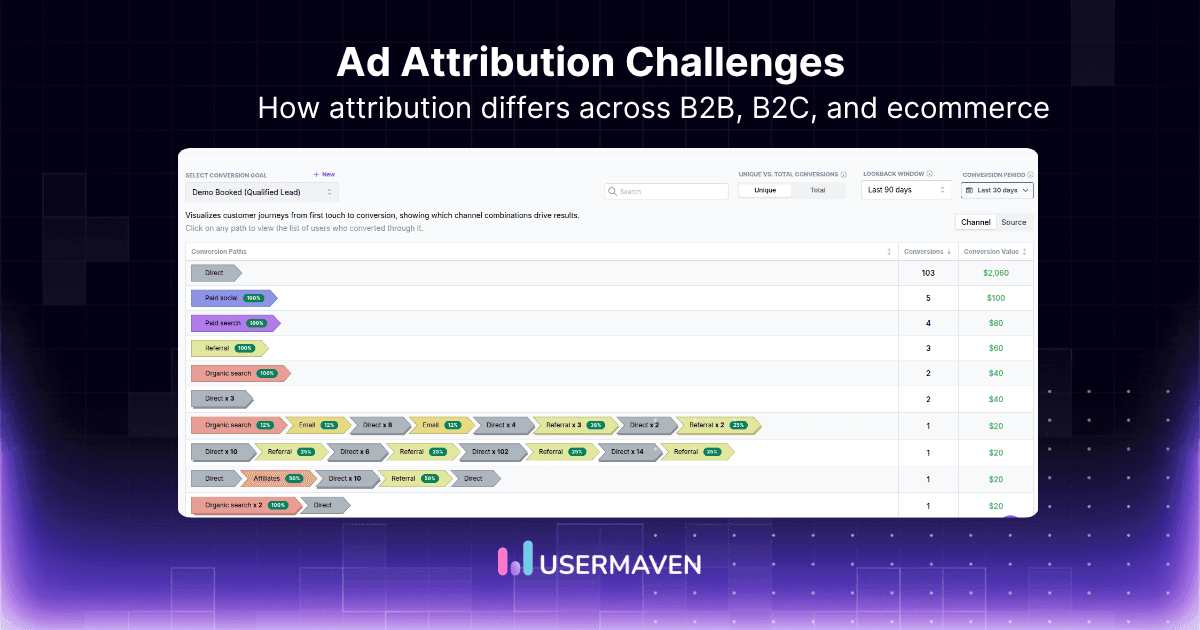
The user journeys feature shows how visitors and users move through website pages, sessions, product actions, and conversion steps.
Teams can identify:
Frequent conversion paths
Drop-off points
Repeated visits
Unexpected detours
Differences between user segments
High-converting sequences
Usermaven’s journey reports support analysis across visitors, identified users, and companies, with path and conversion information available in the same environment.
Compare multiple attribution models
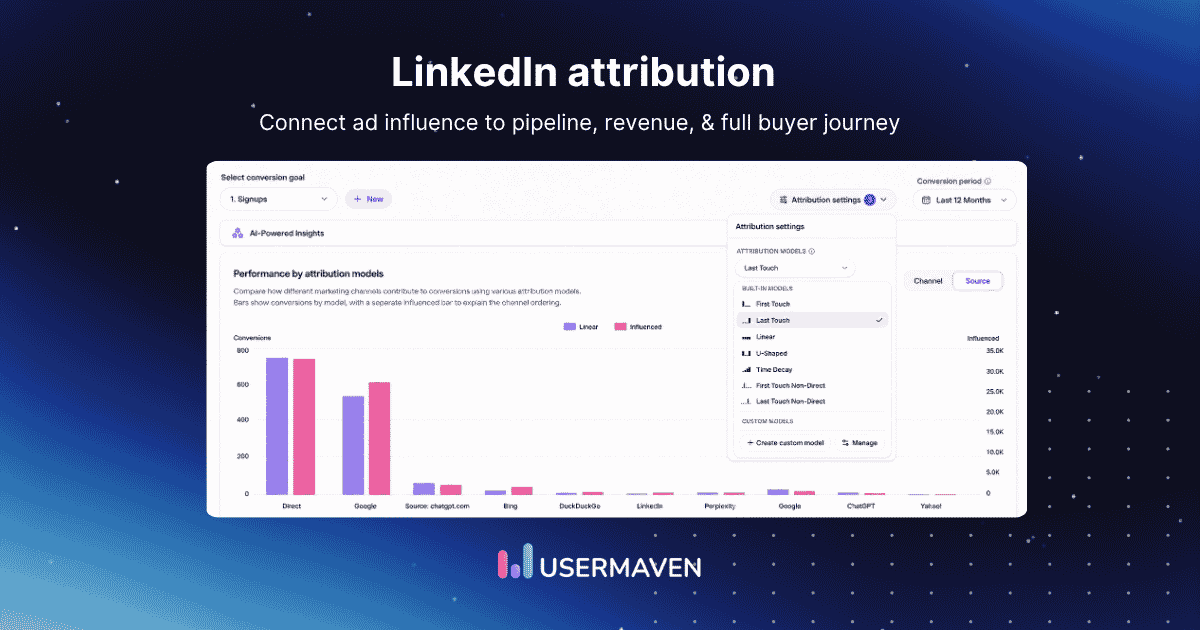
Usermaven allows teams to compare how channel credit changes under different attribution models.
This helps separate changes caused by the model from changes in actual conversions or revenue. Its attribution reporting can display multiple models for the same channel and includes conversion value in conversion-path reporting.
Measure pipeline and closed revenue
Usermaven’s attribution-focused Scale plan includes:
Paid-ad attribution
Channel-level revenue attribution
Content and landing-page attribution
CRM revenue and pipeline attribution
Multi-touch conversion paths
Customer-journey attribution
Conversion synchronization
These capabilities connect marketing activity with qualified leads, opportunities, pipeline, and revenue.
Build an attribution dashboard
A marketing attribution dashboard can combine acquisition, conversion, journey, pipeline, and revenue metrics.
This gives marketing, growth, and revenue teams a shared reporting view without requiring every stakeholder to interpret separate platform dashboards.
Investigate results with Maven AI
Maven AI allows teams to ask questions about traffic, campaigns, conversions, attribution paths, funnels, customer behavior, and revenue.
It can surface channel performance, explain changes, and help teams investigate conversion patterns through natural-language questions.
Start with self-serve access
Usermaven offers public pricing and a 14-day free trial. The Scale plan includes its paid-ad, CRM, conversion-path, customer-journey, and revenue-attribution capabilities.
Final verdict
Marketing attribution metrics and benchmarks should be selected according to the decision they support. External benchmarks can provide useful context, but internal baselines are usually more reliable for deciding whether channel economics, pipeline quality, or customer value are improving.
Revenue metrics explain financial contribution. Pipeline metrics measure opportunity creation and influence. Journey metrics show how channels assist conversion, while CAC and LTV reveal customer quality.
Attribution-model comparisons explain why channel credit changes, but they do not change the underlying number of customers or total business revenue.
Do not track every available number. Track the marketing attribution metrics that connect marketing activity with the business outcome being optimized.
The right marketing attribution software should connect campaigns, customer journeys, conversion paths, CRM pipeline, and revenue while making the model and attribution window clear.
Start a free 14-day Usermaven trial and measure attribution metrics using real campaign, customer, pipeline, and revenue data.
See Usermaven in action
Book a free demo and discover how powerful analytics can grow your business.
*No credit card required
FAQs
1. What are marketing attribution metrics?
Marketing attribution metrics measure how channels, campaigns, and touchpoints receive credit for conversions, pipeline, customers, and revenue.
They include attributed revenue, ROAS, marketing-sourced pipeline, assisted conversions, time to conversion, and LTV by source.
2. What is the most important marketing attribution metric?
There is no universal most important metric. Attributed revenue is useful for financial contribution, pipeline metrics are important for B2B companies, and CAC and LTV are essential for evaluating customer quality.
3. How is attributed revenue calculated?
Attributed revenue is calculated by multiplying the total conversion revenue by the percentage of credit assigned under the selected attribution model.
For example, a channel receiving 30% credit for a $10,000 deal receives $3,000 in attributed revenue.
4. What is the difference between marketing-sourced and marketing-influenced revenue?
Marketing-sourced revenue comes from customers whose journey originated through marketing. Marketing-influenced revenue includes deals that interacted with marketing at any eligible stage, even when another team or channel created the original opportunity.
5. Which attribution metrics matter for B2B companies?
B2B companies should prioritize marketing-sourced pipeline, marketing-influenced pipeline, win rate by source, average deal value, closed revenue, and time to conversion, as these metrics connect marketing activity with account and opportunity outcomes.
6. How do attribution models change marketing metrics?
Attribution models redistribute conversion and revenue credit. First-click favors discovery, last-click favors conversion-stage channels, linear distributes credit evenly, and time-decay favors recent interactions.
7. What is the difference between ROAS and marketing ROI?
ROAS compares attributed advertising revenue with advertising spend. Marketing ROI subtracts marketing costs from the attributed return before comparing the result with the investment.
8. What data is required to calculate attribution metrics?
The required data can include campaign spend, marketing touchpoints, conversion events, customer identities, CRM stages, deal values, billing transactions, and revenue, with the exact inputs depending on the metric being calculated.
9. What are marketing attribution benchmarks?
Marketing attribution benchmarks are internal or external reference points used to compare attribution metrics, measurement practices, or attribution-model adoption. External benchmarks are useful for peer and maturity comparisons, while internal historical baselines are usually more useful for ROAS, CAC, pipeline, win rate, time to conversion, and LTV decisions.
Updated

Written by
Ryan Mitchell
Marketing Analytics Strategist
Ryan Mitchell is a marketing analytics strategist specializing in campaign measurement, customer journeys, and marketing performance. He writes about analytics, reporting, and data-driven marketing strategies, helping SaaS and B2B teams measure what matters across every stage of the customer journey.
All articles by Ryan →