Most people set big resolutions every January, yet studies show most give up within a few weeks. Often the final push gets the praise, while months of small actions are forgotten. Marketing works the same way when teams rely on last-click reports.
The time decay attribution model fixes part of that problem. It is a multi-touch attribution approach that gives more credit to touchpoints that happen closer to conversion, while still counting earlier touches.
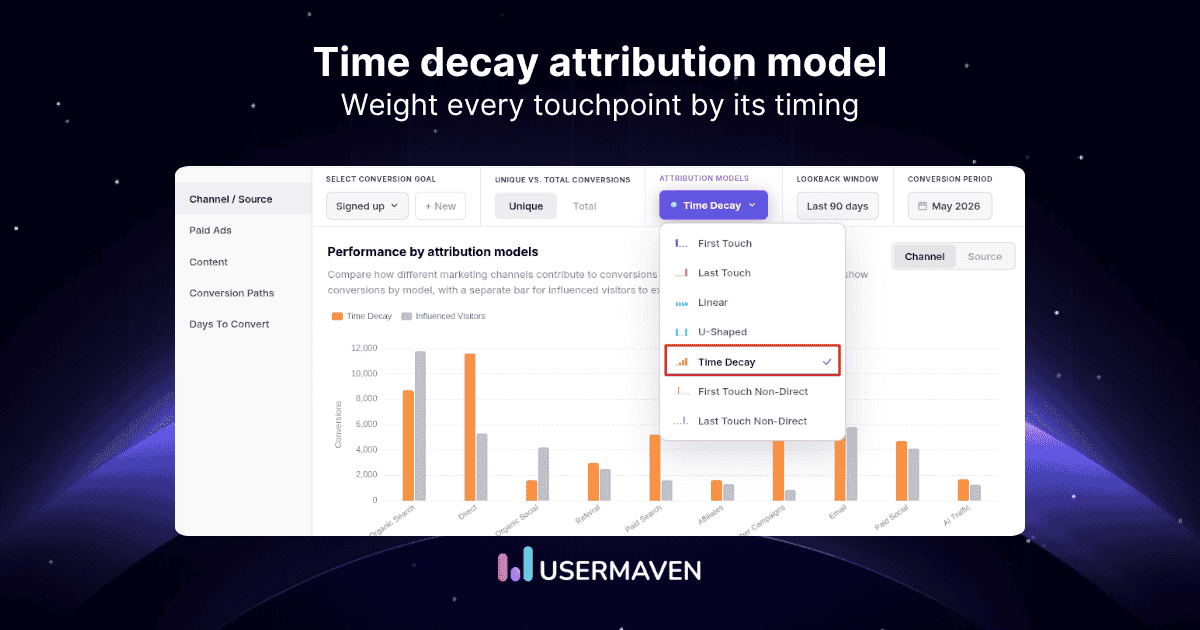
In this guide, you will see what time decay attribution is, how the formula works, when to use it, and how it compares to other marketing attribution models.
By the end, you will know when time decay helps, when it misleads, and how to read the results with confidence.
Key takeaways
- Time decay attribution gives more credit to touchpoints that happen near conversion. Earlier steps still receive a smaller share of the result. This keeps the view multi-touch while matching how people usually decide.
- The model works best for buying paths that last at least 30 days. It shines when leads see several ads, emails, and sales touches before they convert. Short, one or two step purchases usually need something simpler.
- The half life setting controls how fast credit fades over time. A seven day half life is a common starting point in examples. You can lengthen or shorten that value to match your real sales cycle.
- Time based weighting can undervalue brand building and early demand creation. Those touches may matter a lot even if they get little credit. Pairing time decay with other views gives a fuller picture.
- Dedicated tools can apply time decay across all channels and models. This lets you compare time decay, linear, first touch, and last touch attribution in one place. You can then tie those paths to pipeline and revenue.
What is the time decay attribution model?
The time decay attribution model is a multi-touch method that assigns more credit to marketing touchpoints that happen closer to the conversion event. It still awards some credit to earlier touches, but that share shrinks over time using an exponential decay curve.
Instead of giving 100% of credit to the first click or the last click, this model spreads value across the full conversion path. The logic is simple. Actions that happen right before someone fills a form or completes a purchase usually have more influence than something they saw months ago.

Mathematically, each touchpoint gets a weight based on how many days passed between that touch and the conversion. The closer a click, view, or visit is to the finish, the higher its weight. Those weights are then normalized so that the total always adds up to 100% of the conversion or revenue.
Here is a basic B2B example. A prospect sees a display ad on a tech site, two months before signing a contract. Three weeks later they attend a webinar. One day before signing, they click a targeted email from the account executive. In a simple time decay setup, that email might get 50% of the credit, the webinar 30%, and the display ad 20%. Every step counts, but the model pushes more value toward the touches that happen late in the decision process.
To make this useful at scale, you need a platform that can capture all these interactions, stitch them into full paths, and apply the correct model consistently across campaigns.
How does time decay attribution work?
Time decay attribution works by turning a raw conversion path into weighted credit for each touchpoint. It measures the spacing between touches and the final conversion, then turns that timing into percentages.
Here is the process, step by step.

- Record every eligible touchpoint
You first need clean tracking for all marketing and sales interactions that should count. This can include ad clicks, email opens, page views, chat conversations, and sales calls. Each one needs a timestamp and user or account identifier so the path can be ordered correctly. - Measure how long before conversion each occurred
For every path, calculate how many days passed between each touch and the conversion. A click one day before conversion will have a lower gap than a webinar visit three weeks before. These time gaps feed directly into the decay function. - Apply a decay weight using the selected half life
Next, plug each time gap into the exponential formula for the chosen half life. Touchpoints that are close to the conversion get a raw weight near 1. Older touches get much smaller raw weights as the formula reduces their value. - Normalize the weights and distribute credit
Finally, sum all raw weights on the path, then divide each raw weight by that sum. The result is a percentage share of the conversion or revenue for each touch. When you visualize these paths, you see a clear rise in credit as touches move closer to the final action. - Aggregate results across channels and campaigns
Once each path is scored, you can roll up the data. For example:- Total revenue credited to each channel
- Average number of touches before conversion
- Common late-stage sequences that appear before closed won deals
These aggregated views help you see which activities deserve more budget and which ones only appear on weak paths.
Time decay attribution formula and half-life
The time decay attribution formula turns timing into numbers that are easy to compare. Most tools use an exponential function that halves a touchpoint’s value after a chosen number of days, known as the half life.
This approach mirrors research on time-decay attribution models using half-life in exponential decay for e-commerce conversion analysis, where the standard formula looks like this in many examples.
Weight = 2^(-t / half life)
Here ‘t’ is the number of days between the touchpoint and the conversion. The half life controls how quickly value drops as touches get older.
What does half-life mean?
Half life in this context is the number of days it takes for a touchpoint’s weight to drop to half of its value at the moment of conversion. If you pick a seven day half life, a touch on the conversion day has a weight of 1. A touch seven days earlier has a raw weight of 0.5, because it is half as fresh. Fourteen days earlier, the raw weight drops again to 0.25. After twenty one days, the same logic gives a weight of 0.125, which is one eighth of the freshest touch.
This setup keeps the curve smooth. Every extra day between the touch and the conversion slightly reduces its impact, instead of dropping it to zero after a fixed cut-off.
How to choose the right half-life
Choosing a half life should match how long people usually take to move from first contact to conversion. A team with a 45 day median sales cycle might start with a 15 day half life so early and late steps both matter. For a self-serve SaaS with a 10 day trial window, a shorter half life, such as five days, will highlight behavior just before upgrade.
To pick and refine a half life, you can:
- Look at your median sales cycle and consider a half life around one third of that span.
- Run the model with two or three half life values and compare how channel credit shifts.
- Talk with sales and customer success to see if the model’s story matches what they see in real deals.
- Review a few individual journeys to make sure key touches are not being discounted too quickly.
The best way to tune this value is to test a few options, check how the credit shifts by channel, and compare those results to what sales teams see on the ground.
When should you use time decay attribution (and when not)?
Time decay attribution is a strong fit for longer, multi-step buying paths where recency probably reflects real influence. It helps you see which touches close deals without fully ignoring early awareness work.

You get the most value from this model in specific situations.
- Your typical sales cycle lasts between 30 and 180 days. Buyers research, compare, and talk with sales before deciding. In this case, it helps to see how later touches like demos, comparison pages, and bottom funnel ads push deals over the line.
- Leads interact with many channels and messages across that period. They might see paid social, then organic search, then email, then a sales call. Time decay helps you find which combination of recent touches is often present when deals close.
- Your main focus is pipeline, revenue, and ROAS rather than pure awareness. You care more about which actions move people from late evaluation to paid customer. The model answers where to invest if you need more conversions this quarter.
There are also cases where time decay attribution can mislead.
- If your buying path usually finishes within a few days, a last touch attribution model is often simpler and just as accurate. There is too little spacing between touches for a decay curve to add much value.
- If the main goal of a campaign is reach and awareness, a first touch attribution model or marketing mix modeling can be more useful. Time decay often gives little credit to the early impressions that create demand.
- If your tracking is patchy, with missing UTMs or channels, time based weighting can amplify errors. You may need to fix data collection or use a simpler view until you can trust the timestamps for every key touch.
In practice, many teams use time decay alongside other models. Comparing views helps you avoid overreacting to what any single model says.
Time decay attribution example
A time decay attribution example makes the math easier to see. Imagine a $10,000 deal that follows this path before the contract is signed. We will use a seven day half life.
| Touchpoint | Days before conversion | Raw weight | Normalized credit | Attributed revenue |
|---|---|---|---|---|
| Paid social ad | 21 | 0.125 | 5% | $500 |
| Organic search | 7 | 0.5 | 22% | $2,200 |
| Nurture email | 3 | 0.75 | 33% | $3,300 |
| Demo meeting | 1 | 0.9 | 40% | $4,000 |
In this path, every touch gets some share of the deal, but the demo and email take most of the value. That pattern tells you late stage email and sales work deserve strong funding, while still showing that paid social and organic search play a supporting role.

You can use this kind of table to:
- Compare attributed revenue by channel across many deals
- Spot channels that show often at the end of high-value paths
- Identify early-stage campaigns that never appear near conversions
Advantages and limitations of time decay attribution
Time decay attribution sits between very simple single touch views and heavy data driven attribution models. It has clear strengths but also real blind spots you should keep in mind.
| Aspect | Advantage | Limitation |
|---|---|---|
| Multiple interactions | Credits several touches instead of only first or last | May still understate very early awareness activity |
| Recent conversion assists | Highlights actions close to conversion that help close deals | Assumes recent equals influential, which is not always correct |
| Ease of explanation | Uses a clear, rule based formula most teams can understand | Formula can still feel abstract to non technical stakeholders |
| Half life setting | Lets you tune the decay speed to match your real sales cycle | Poorly chosen half life can distort which channels seem to perform best |
| Data requirements | Works well when event tracking is complete and consistent | Breaks down when UTMs, devices, or sessions are missing or fragmented |
| Causation and incrementality | Provides directional insight into which touches matter | Does not prove what would have happened without a given touchpoint |
To work around these limits, many organizations combine time decay with:
- Lift tests and experiments for key campaigns
- Marketing mix modeling for long-term budget decisions
- Qualitative feedback from sales and customers on what influenced them most
Time decay vs other attribution models
Here is a high level comparison between time decay and other attribution models.
| Model | How credit is assigned | Best fit scenario | How it differs from time decay |
|---|---|---|---|
| First touch attribution model | 100% credit to the very first interaction | Measuring which channels start new relationships | Time decay spreads credit and favors recent touches instead |
| Last touch attribution model | 100% credit to the final interaction before conversion | Short, simple paths with few steps | Time decay still counts earlier steps on the path |
| Linear attribution model | Equal credit to every recorded touchpoint | Education heavy paths where each step is similar in importance | Time decay replaces equal splits with a recency based curve |
| U-shaped attribution model | Higher credit to first and last interactions, less to middle | Paths where introduction and closing steps are viewed as key | Time decay changes weights smoothly with time, not by position |
| Data driven attribution model | Machine learning uses real conversion data to set weights | High volume programs across many channels and campaigns | Time decay is rule based and transparent rather than algorithmic |
For deeper background on specific models, you can explore our guides to the linear attribution model and u shaped attribution model. Time decay usually sits between those options, giving more nuance than single touch views without the complexity of full data driven attribution.
Does GA4 support time decay attribution?
GA4 does not currently include a selectable time decay attribution model in its standard reports. Google Ads also removed time decay attribution as a built in setting, focusing instead on data driven and last click views.
Universal Analytics once documented time decay examples with a seven day half life, but those presets are no longer active. If you still want a decay attribution model for GA4 data, you need either a custom attribution model in a data warehouse or a dedicated platform such as Usermaven that can import events and apply its own weights.
How to use time decay attribution with Usermaven
Usermaven is an AI-powered attribution platform that helps you see which marketing touchpoints build conversion momentum and which channels generate pipeline and revenue. It combines data from your website, Google Ads, Meta Ads, email platforms, CRM, and other integrations to create a unified view of each customer journey.

With Usermaven’s multi-touch attribution, you can use the time decay attribution model to:
- Identify recent campaigns and touchpoints that influence conversions
- Connect marketing activity with pipeline, closed-won revenue, ROAS, and days to convert
- Compare time decay with linear, first-touch, last-touch, U-shaped, and other attribution models
- Analyze performance across channels, campaigns, customer segments, and conversion paths
- Adjust the attribution window to reflect your typical sales cycle
- Use Maven AI to uncover patterns and opportunities without manually reviewing complex reports
These insights help you optimize conversion-focused campaigns, improve nurture and retargeting efforts, and allocate more budget to the channels that contribute to measurable business outcomes.
Conclusion
The time decay attribution model helps you understand which recent marketing touchpoints contribute most to conversions and revenue. However, it can undervalue early interactions that build awareness and demand. Comparing it with first-touch, last-touch, linear, and data-driven attribution gives you a more balanced view of the customer journey.
Usermaven makes this comparison simple. As one of the best marketing attribution tools, it connects your marketing, product, CRM, and revenue data, tracks complete user journeys, and lets you compare attribution models in one place.
Ready to uncover which channels truly drive growth?
Ready to see Usermaven in action? Explore the platform or book a demo for a closer look.
Frequently asked questions
Is time decay a multi-touch attribution model?
Yes, time decay is a multi-touch attribution model. It assigns credit to every recorded touchpoint on the path instead of just one step. The key difference is that touches closer to conversion receive more credit, while older touches receive less based on the decay formula. This keeps the view full path while still favoring recent actions.
What is a seven-day half-life in attribution?
A seven day half life means a touchpoint that happens seven days before conversion is worth half as much as a touch on the conversion day. With this setting, a touch fourteen days before conversion is worth one quarter, and twenty one days before is worth one eighth. You can adjust the half life to fit your own sales cycle and buying behavior.
Is time decay better than linear attribution?
Time decay is often better than linear attribution when recency clearly matters in your sales process. Linear attribution splits credit evenly across all touches, no matter when they happened. Time decay keeps the full path but pushes more credit toward late stage actions such as demos or pricing page visits. The better model depends on your goals and path shape.
Does time decay work for long B2B sales cycles?
Yes, time decay often works well for long B2B sales cycles with many touchpoints. It helps highlight the channels and assets that appear most often near closed won deals, such as comparison pages, late stage ads, or sales emails. At the same time, it still assigns some value to earlier actions, so you do not look only at the final step.
Can time decay attribution measure incremental impact?
Time decay attribution shows which touchpoints tend to appear before conversions, but it does not prove incremental impact by itself. The model cannot show what would have happened if a touchpoint did not exist. To study true lift, teams usually combine attribution with experiments, holdout tests, or marketing mix modeling that looks at changes in spend and results over time.
Updated

Written by
Adeel Khan
Growth Marketing Expert
Adeel Khan is a full-stack SaaS marketer with 10+ years of experience in content marketing, paid advertising, analytics, and conversion rate optimization. He shares practical insights and strategies drawn from hands-on experience, helping B2B SaaS marketers improve performance and make better marketing decisions.
All articles by Adeel →