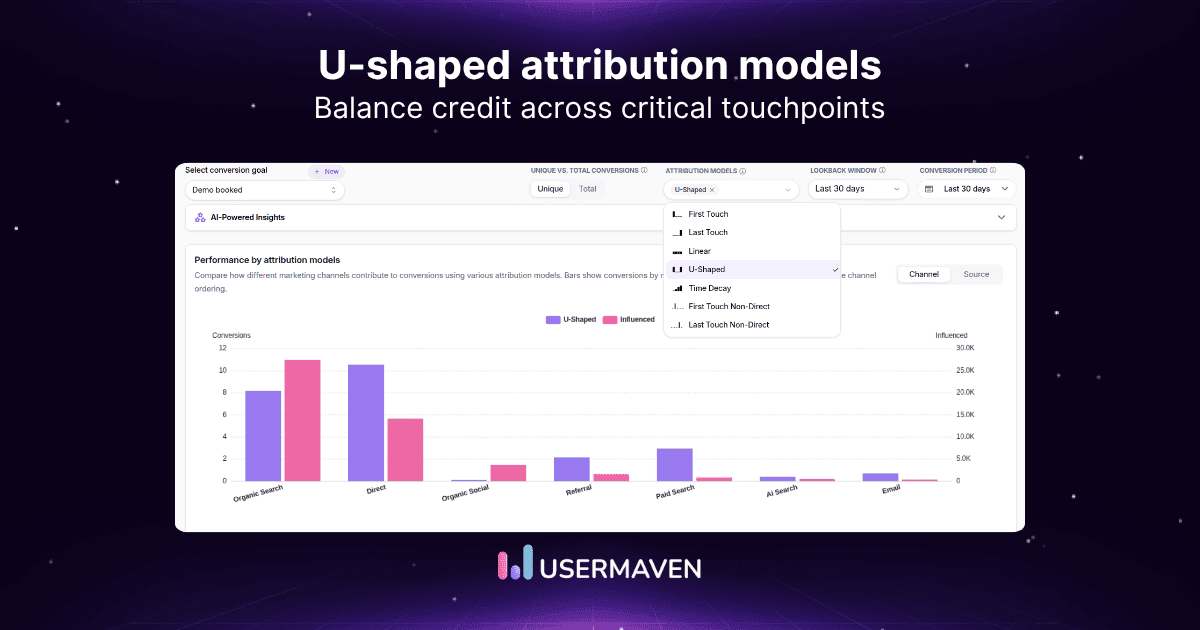
In most customer journeys, the beginning gets attention, the ending gets credit, and everything in between becomes a blur. The U-shaped attribution model turns that pattern into a measurable framework.
Also known as position-based attribution, it assigns 40% of the conversion credit to the first touchpoint and 40% to the final touchpoint. The remaining 20% is divided among the interactions in between. This creates the familiar U-shaped distribution.
But a simple formula does not guarantee an accurate answer.
This guide explains how U-shaped attribution works, how to calculate it, when it makes sense, and when its emphasis on the first and last interactions may hide the real influence of your marketing channels.
Key takeaways
- The U-shaped attribution model is a position-based, rule-based multi-touch attribution model. It gives 40% credit to the first interaction and 40% to the final interaction. The remaining 20% of conversion credit is shared by all intermediate interactions.
- The standard 40/20/40 split stays fixed across every conversion path. That makes results easy to explain and compare across channels. You do not need complex machine learning or custom models.
- This model fits B2B lead generation, SaaS, and considered ecommerce purchases. In those cases both acquisition channels and conversion channels matter a lot. You want to see how discovery and closing activities work together across the customer journey.
- The main risk is middle-touchpoint undervaluation. Content, SEO, and nurture campaigns may look weak because they share only 20% of marketing attribution strategy. You still need separate metrics to judge these programs.
What is the U-shaped attribution model?
The U-shaped attribution model is a position-based multi-touch attribution approach that shares conversion credit across several interactions. It gives the largest share to the first and last touches, then splits a smaller share across any middle interactions in the buyer path.

You will also see it described as U-shaped attribution, position-based attribution, the 40/20/40 attribution model, or the bathtub attribution model because of its shape on a chart. All of these names describe the same basic idea of weighting the start and end of the customer journey more than the middle.
Unlike data-driven marketing, which learns weights from real behavior over time, this model uses a fixed rule that never changes. That rule-based nature keeps it easy to apply across Google Ads, Meta Ads, email, and other channels, as long as your cross-channel marketing attribution records each marketing touchpoint in order.
How does U-shaped attribution work?
The U-shaped attribution model works by splitting conversion value into three buckets for every conversion path. It assigns 40% of attribution credit to the first touchpoint, 40% to the last touchpoint, and shares the remaining 20% across all middle interactions.
In practice that means a Google Ads click that starts the buyer journey can earn the same channel contribution as the email that closes it. Intermediate interactions such as a LinkedIn ad, a blog post, or a webinar still receive credit, but they must divide a fixed 20% pool between them.
You can think of it in three parts:
- First touchpoint receives 40% of the conversion value.
This is the first recorded interaction within your attribution window, such as a search ad click or a discovery webinar. It highlights which acquisition channels introduce new prospects. - Middle touchpoints share 20% of the conversion value.
Each middle touchpoint gets an equal slice of that pool, which shrinks as more touches appear in the path. This is where middle-touchpoint undervaluation often shows up. - Last touchpoint receives the final 40% of the conversion value.
This is the event closest to conversion, such as a pricing page visit or demo request form submit. It tells you which conversion channels are best at closing deals.
If there are no middle touchpoints, the model behaves like a simple 50/50 split between the first and last interactions.
U-shaped attribution formula
The math behind the U-shaped attribution model is simple and uses the same percentages every time. You multiply the total conversion value by fixed weights for first, middle, and last touches, then sum the attributed revenue by channel.
40/20/40 U-shaped formula
First-touch credit = conversion value × 40%
Last-touch credit = conversion value × 40%
Each middle touch credit = conversion value × 20% ÷ number of middle touches
Most analytics tools apply this 40/20/40 attribution model for you once you choose it in their attribution settings.
Maximize your ROI
with accurate attribution
U-shaped attribution example
To see the U-shaped attribution model in action, consider a simple B2B SaaS buyer journey. A prospect follows this path before booking a paid demo:
Google ad → Blog post → Webinar → Pricing page → Demo request
Assume the demo request leads to $1,000 in conversion value. Using U-shaped attribution, the first touch, Google Ads, receives $400 of attributed revenue, and the last touch, the demo request event, also receives $400. The remaining $200 is split equally across the three middle touchpoints.
Each middle interaction, the blog post, the webinar, and the pricing page view, therefore receives about $66.67 of attribution credit. This keeps them visible in your reporting without letting them overshadow the discovery and closing steps.
- Google ad as the first interaction receives $400. This reflects 40% of the $1,000 conversion value. It highlights the acquisition channel that started the relationship.
- Demo request as the final interaction receives $400. This is another 40% share of the same conversion value. It credits the conversion channel that turned interest into a sales opportunity.
- Each of the three middle touches receives about $66.67. Together they make up the final 20% of the $1,000 conversion value. This keeps all intermediate interactions on the radar while still favoring the bookend events.
| Channel | Journey position | Percentage of credit | Attributed revenue |
|---|---|---|---|
| Google ad | First | 40% | $400 |
| Blog post | Middle | 6.67% | $66.67 |
| Webinar | Middle | 6.67% | $66.67 |
| Pricing page | Middle | 6.67% | $66.67 |
| Demo request | Last | 40% | $400 |
When should you use U-shaped attribution?
You should use U-shaped attribution when both acquisition channels and conversion channels matter for your decisions. The model works well when a customer moves across several measurable marketing touchpoints and you care most about how they first arrived and how they finally converted.
That pattern appears in many B2B lead generation programs, SaaS funnels, and higher-priced ecommerce purchases on platforms such as Shopify or Magento. In these cases you need a view that connects early ads or content to later forms, demos, and deals.
Use U-shaped attribution when:
- Both acquisition and conversion channels matter.
You want to know which campaigns drive new contacts and which ones close them. U-shaped attribution shows both in the same report. - Customers interact with several measurable touchpoints.
Prospects often click Google Ads, use LinkedIn, read nurture email, and review comparison pages before they buy. A single-touch model would hide most of that activity in the buyer journey. - The journey has clear starting and conversion points.
You can define a first touch, such as an ad click, and a conversion event, such as a demo request or checkout. That clarity keeps the 40/20/40 split easy to apply. - Teams need an understandable alternative to data-driven attribution.
Stakeholders can read the simple 40% and 20% weights without needing a statistics background. That helps marketing and finance stay aligned on budget choices. - You want to evaluate top-of-funnel and bottom-of-funnel performance together.
The model compares how well awareness channels create new paths and how well closing channels convert them. That supports clearer ROI views and more grounded revenue tracking.
When should you not use it?
U-shaped attribution is not a good fit when the buying process is very short or when middle interactions carry most of the weight. In those cases the fixed 40/20/40 rule can distort channel contribution and hide important touchpoints.
You should also be cautious when key milestones happen in the middle of the path, such as lead attribution software in a CRM like Salesforce or opportunity creation in HubSpot. Other multi-touch attribution models, such as W-shaped or data-driven, may align better with those needs.
Avoid or limit U-shaped attribution when:
- Single-session or very short journeys dominate.
Think of impulse ecommerce purchases where a Meta ad click leads straight to checkout. Last-touch or time-decay models usually describe these flows more clearly. - Content-heavy nurture journeys drive most revenue.
If prospects read many blog posts, whitepapers, and product docs before they talk to sales, those middle touches do most of the work. Linear or data-driven attribution can highlight that effort better. - Funnels have an important lead or opportunity milestone.
When a demo, trial signup, or MQL event is the key moment, W-shaped attribution makes that middle stage a peak, not a valley. U-shaped attribution keeps that step in the smaller 20% pool. - Journeys include substantial offline or untracked activity.
Events, phone calls, and partner referrals often go missing without strong first-party data and identity resolution. Any model that ignores many touches, including U-shaped, will give shaky answers. - Businesses have enough reliable data for algorithmic attribution.
If you have large volumes of conversions in tools like GA4, data-driven attribution can estimate true channel influence with more nuance. Fixed rules become a starting point, not the final word.
U-shaped attribution benefits and limitations
Like every marketing attribution software, the U-shaped approach brings tradeoffs. It offers a clear view of how first and last touches drive revenue while simplifying middle interactions, which can both help and hurt depending on your funnel.
| Benefits | Limitations |
|---|---|
| Credits both discovery and conversion touchpoints | Uses an assumed 40/20/40 weighting |
| Includes every recorded touchpoint | Can undervalue middle interactions |
| Easy to calculate and explain | Does not measure actual causal influence |
| More complete than single-touch models | Results depend on tracking quality and CRM data |
| Helps compare acquisition and conversion channels | May oversimplify long or complex funnels |
Note: You should treat these as pros and cons, not as proof that U-shaped attribution is always the best attribution model for B2B or any other segment.
U-shaped vs other attribution models
To judge whether the U-shaped attribution model is right for you, compare it with other common models. Each option assigns conversion credit differently and answers a slightly different business question.
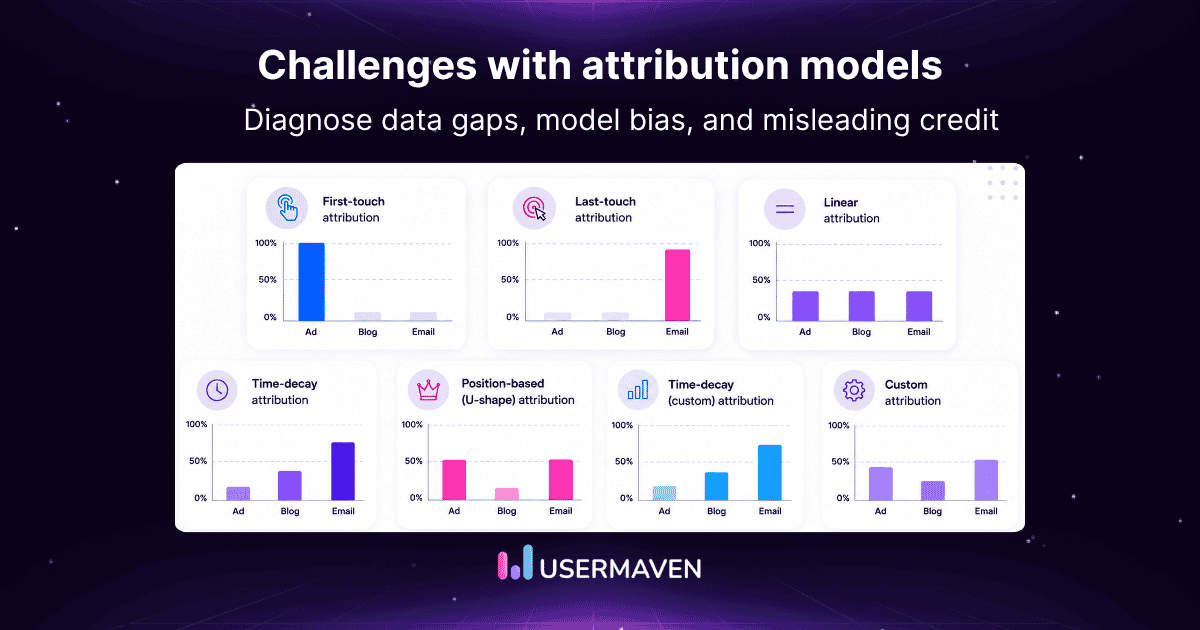
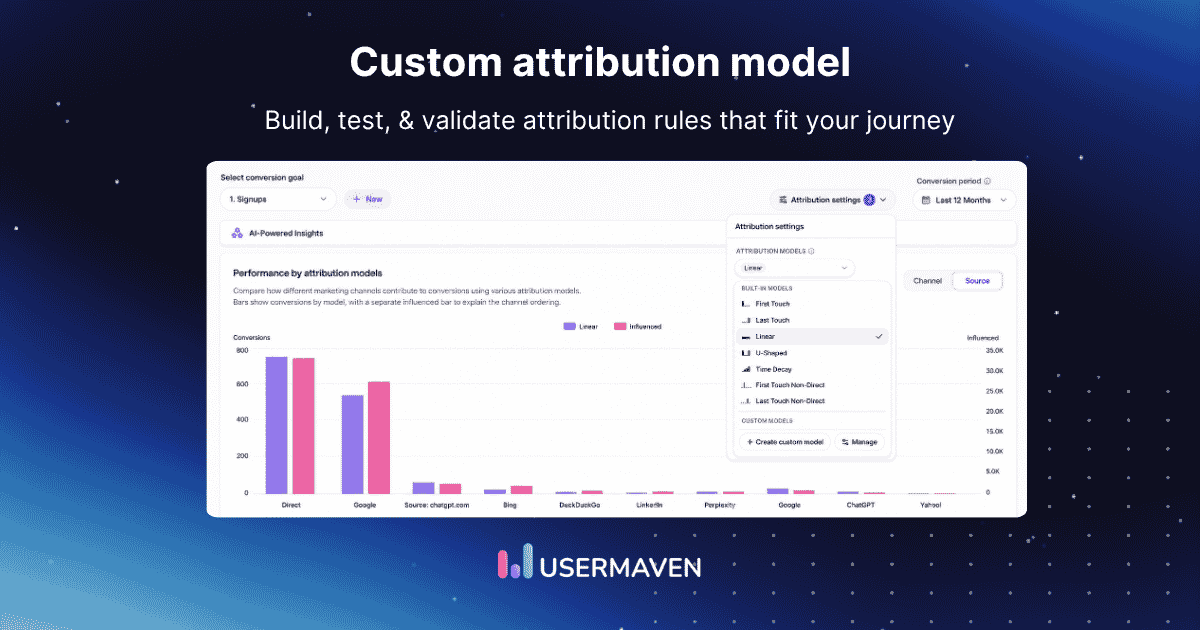
Analytics platforms differ significantly in the attribution models they support. Google Analytics 4 currently offers data-driven attribution and two last-click options, while specialized marketing attribution platforms like Usermaven provides first-touch, last-touch, linear, time-decay, U-shaped, W-shaped, and other multi-touch models.
Some tools also support first non-direct and last non-direct variants that strip out direct traffic when assigning credit.
| Model | Credit assignment | Best used when |
|---|---|---|
| First-touch | 100% to the first touch | Measuring acquisition and first contact |
| Last-touch | 100% to the final touch | Measuring conversion triggers and closing channels |
| Linear | Equal credit across every touch | Each interaction is considered equally important |
| Time-decay | More credit to recent touches | Recency and late-stage touches matter most |
| U-shaped | 40% first, 40% last, 20% middle | Acquisition and conversion both matter |
| W-shaped | Emphasizes three funnel milestones | B2B funnels have a defined lead or opportunity stage |
| Data-driven | Uses observed data to assign credit | Sufficient clean conversion data is available |
There is no single best attribution model for B2B or ecommerce. The right choice depends on your sales cycle, data quality, and the decisions you need to support.
U-shaped vs W-shaped attribution
U-shaped and W-shaped attribution are both position-based models, but they prioritize different stages of the customer journey. U-shaped attribution assigns the most credit to the first and final touchpoints, while W-shaped attribution also gives significant credit to an important middle-funnel milestone, such as lead creation, a trial signup, or an MQL.
Use U-shaped attribution when acquisition and conversion are the two most important stages you want to evaluate. Choose W-shaped attribution when a key middle-funnel interaction plays an equally important role in moving prospects toward conversion.
How to implement U-shaped attribution
Implementing the U-shaped attribution model is less about math and more about data plumbing. You need reliable first-party data, identity resolution across devices, and clean UTM tagging before the 40/20/40 rule can work well.
Follow these steps:
- Define the conversion event and value.
Decide whether you track leads, paid signups, or revenue. Assign a clear monetary amount for each conversion so you can calculate meaningful attributed revenue. - Track customer interactions across channels.
Use analytics such as GA4, advertising pixels, and email tracking to record every touchpoint. Make sure you respect consent rules and keep cross-channel tracking consistent. - Connect marketing, product, CRM, and revenue data.
Integrate tools like HubSpot, Salesforce, Stripe, and your product analytics. Strong CRM integration lets you link web sessions to contacts, opportunities, and closed-won deals. - Set an appropriate attribution window.
Choose how far back first interactions can count, for example 30, 60, or 90 days. Align this with your typical sales cycle so you do not drop important early touches. - Apply the 40/20/40 calculation.
Your attribution platform should apply the U-shaped formula to every conversion path. If needed, you can export data and run the math in SQL or Python for custom revenue tracking. - Compare the results with another model.
Look at the same period using last-touch, first-touch, or linear attribution. Check which channels move up or down in attributed revenue and how that affects budget decisions. - Review whether middle touches are being undervalued.
Pay close attention to content, SEO, and nurture email. Add separate KPIs such as engagement, assisted conversions, or pipeline influence so these programs are not judged only by U-shaped reports.
Measure U-shaped attribution with Usermaven
An AI-powered attribution platform such as Usermaven helps you run U-shaped attribution without wrestling with spreadsheets. It connects ad platforms, website activity, product data, CRM records, and billing tools so every touchpoint appears in a single customer journey view.

The platform collects first-party data using automatic event capture and server-side tracking that is resistant to many ad blockers. That data feeds seven attribution models, including U-shaped, first-touch, last-touch, linear, time-decay, first non-direct, and last non-direct, so you can compare channel performance from several angles.
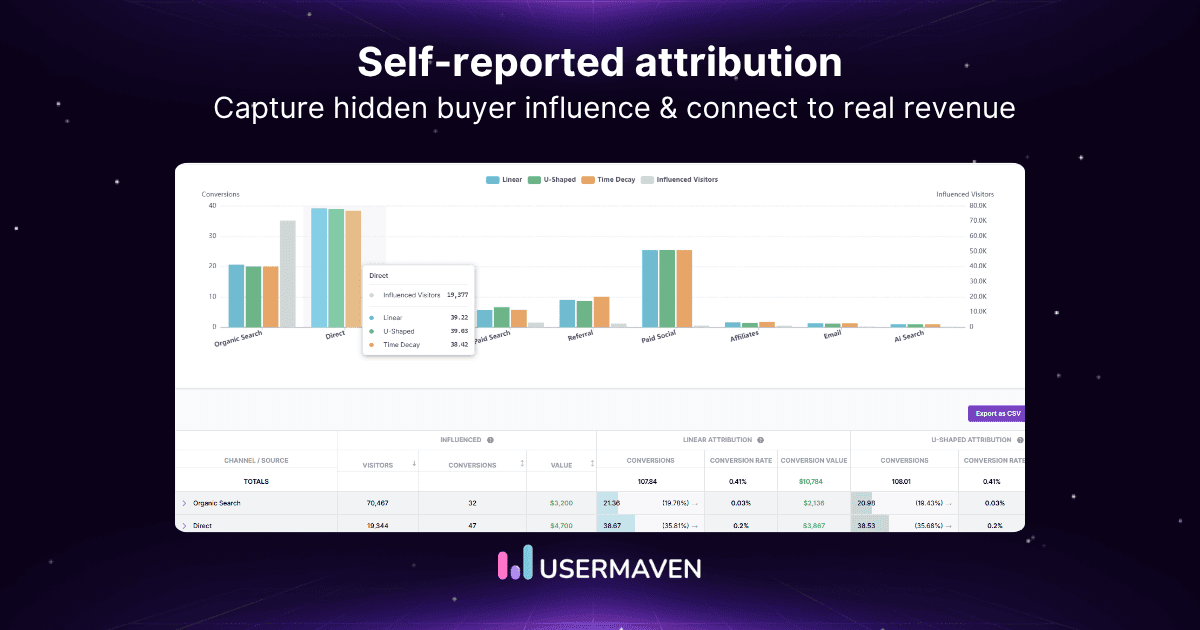
You can compare these models on the same funnels, conversion paths, and pipelines to see how channel contribution and how to calculate ROAS change. Features such as user journey reports, funnel analysis, and AI-assisted insights surface which campaigns, ads, and pages most often appear as first or last touches.
Ready to see Usermaven in action? Explore the platform or book a demo for a closer look.
Maximize your ROI
with accurate attribution
Conclusion
The right attribution model depends on your sales cycle, data quality, and the questions you need to answer. The U-shaped attribution model fits best when discovery and conversion deserve most of the weight, and when you still want middle interactions to appear in the report.
Avoid leaning on it as your only view if long nurture paths, key lead milestones, or offline touches do much of the heavy lifting. In those cases you should compare U-shaped reports with linear, time-decay, W-shaped, and data-driven models before you reassign budgets.
If you want to try U-shaped attribution without building your own tracking stack, an AI-powered analytics and attribution platform such as Usermaven can help. Test it against other multi-touch attribution models, then keep the one that produces the clearest, most actionable picture of channel contribution and revenue.
Frequently asked questions
Is U-shaped attribution the same as position-based attribution?
Yes, U-shaped attribution and position-based attribution describe the same general idea. Both refer to models that give extra credit to specific positions in the path, most often the first and last touches. Many tools use the term position-based to cover U-shaped, W-shaped, and similar variants, so always check the exact weightings in your analytics settings.
Why does U-shaped attribution use a 40/20/40 split?
The 40/20/40 split is a design choice, not a law of marketing. It reflects the belief that first and last touches usually matter most, while middle touchpoints support them. Because the percentages are fixed and easy to remember, they help teams read reports quickly and compare results across campaigns and channels.
What happens if a customer journey has only one or two touchpoints?
If there is only one touchpoint, most platforms treat it as both first and last, so it receives 100% of conversion credit. If there are exactly two touchpoints, each one usually receives 50% credit because there are no intermediate interactions to share the 20% pool under the U-shaped rule.
How does U-shaped attribution affect budget allocation?
U-shaped attribution tends to send more budget toward strong acquisition and conversion channels. Early discovery campaigns and closing campaigns appear more influential, while mid-funnel content may look weaker. To avoid cutting important nurture programs, pair U-shaped reports with additional metrics such as assisted pipeline or time-to-close.
Is U-shaped attribution more accurate than data-driven attribution?
No, U-shaped attribution is simpler but rarely more accurate than a good data-driven model. Data-driven attribution uses observed behavior across many conversions to estimate each channel’s true influence. U-shaped attribution remains useful when you lack enough clean data, need fast answers, or want a rule-based view that stakeholders can understand at a glance.
Updated

Written by
Lauren Brooks
Lifecycle Marketing Strategist
Lauren Brooks is a lifecycle marketing strategist with 4+ years of experience helping SaaS businesses create meaningful customer experiences. She specializes in user engagement, retention, and conversion optimization, helping brands build stronger customer relationships beyond acquisition.
All articles by Lauren →